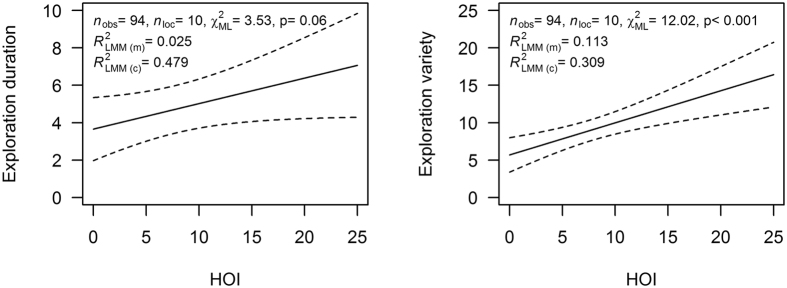
Figure 5. The relationships between the human orientation index (HOI) and exploration behaviour showed significant dependencies in Linear-Mixed-Effect-Models (LMM) that controlled for repeated observations in each facility.
(a) Exploration duration in relation to HOI-index (Nobs = 94, Nlocation = 10, χ2ML = 3.53, R2LMM(m) = 0.025, P = 0.06). (b) Total variety of exploration actions in relation to the HOI (Nobs = 94, Nlocation = 10, χ2ML = 12.02, R2LMM(m) = 0.1113, P < 0.001).

