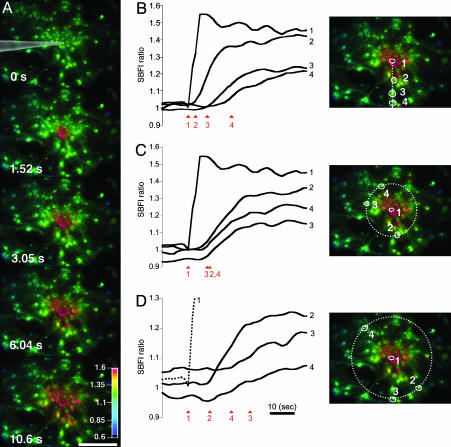
Fig. 1.
Astrocytes generate intercellular  waves. (A) Intensity-modulated-display images of SBFI excitation ratio recorded in cultured astrocytes showing the
  elevation over time after single-cell mechanical stimulation. The top image shows the pipette tip position over the cell. The false colors represent SBFI ratio values corresponding to
  ranging from dark green for resting values to red for elevated values. (Scale bar, 200 μm.) (B) Single cell SBFI ratio values plotted against time. The corresponding cells (white regions, Right) were randomly selected along a line (dotted line) starting from the stimulated cell 1. The red arrows represent the onset of response in each cell defined as the timepoint preceding a signal increase >2 SD over baseline. The graph shows that the
  increase occurred sequentially in a cell-by-cell manner along the line. (C)Na+ increase for regions selected at a radial distance of 180 μm (dotted circle, Right). The arrows shows that at an equal given distance,
  increase is synchronous. (D)
  increase for cells selected 210 μm from the stimulated spot (dotted circle, Right). The red arrows indicate that, at this distance,
  increases are no longer synchronous (n = 6 experiments).

