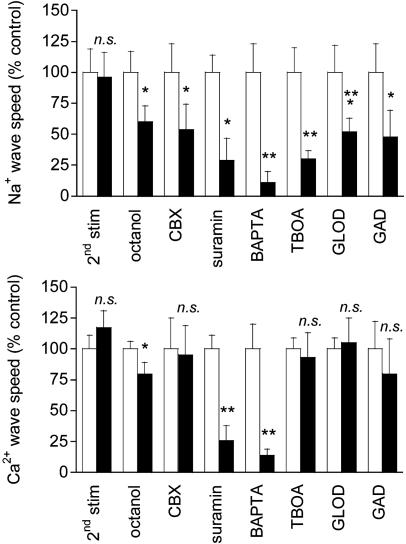
Fig. 3.
Mechanism of Ca2+ and Na+ wave propagation. Results from Na+ (Upper) or Ca2+ (Lower) waves triggered by a first electrical stimulation as a control (white bars) and a second consecutive stimulation (black bars) are shown. Data are presented as percentage of the control wave speed. The waves triggered by two consecutive stimulations were not significantly different (2nd stim) (n = 9 experiments). Blocking gap junctions with 500 μM octanol (n = 8 experiments) or 20 μM carbenoxolone (CBX, n = 6 experiments) had a modest, if any, effect on the Ca2+ wave speed, but a more pronounced effect on the Na+ wave. Both Ca2+ and Na+ waves were inhibited up to 70% by the purinergic receptor antagonist suramin (100 μM, n = 6 experiments). Chelating intracellular Ca2+ by treatment with 50 μM BAPTA-AM massively inhibited both waves (n = 6 experiments). Application of the glutamate transporter inhibitor TBOA (500 μM) resulted in a strong inhibition of the Na+ wave. By contrast, the Ca2+ wave was not influenced by the presence of TBOA (n = 7 experiments). Na+ waves were ≈50% reduced by application of either glutamate oxidase (GLOD; 1 unit/ml) in the extracellular medium (n = 6 experiments) or glutamate decarboxylase (GAD; 40 units/ml) (n = 6 experiments). Ca2+ waves were not influenced by either GLOD or GAD. Data are means ± SEM (*, P < 0.05; **, P < 0.01; ***, P < 0.001). n.s., Not significant.

