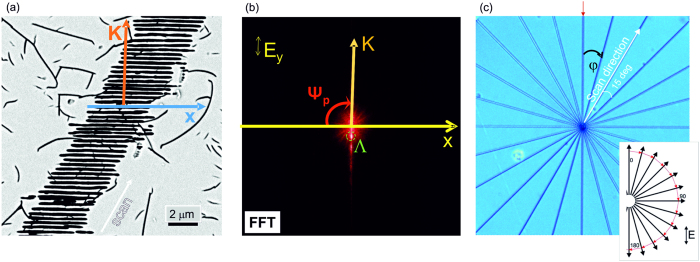
Figure 2. Determination of the nanograting tilt angle Ψ for different scanning directions.
(a) SEM image of sub-surface nanogratings in fused silica recorded at 10 μm depth and polished afterwards for observation. The wave vector K is defined as K = 2π/Λ, where Λis the nanograting period, and the K direction is orthogonal to the nanograting orientation. (b) Fast Fourier transform (FFT) image of the SEM image shown in (a); polarisation Ey is fixed in all experiments. The angle Ψp is defined as the angle between the horizontal reference axis and the nanograting wave vector. (c) Optical image of the “star” pattern with the Δφ = 15° angle between subsequent rays. The red arrow shows φ = 0° position; inset shows fabrication orientation with all lines drawn from the centre outwards.

