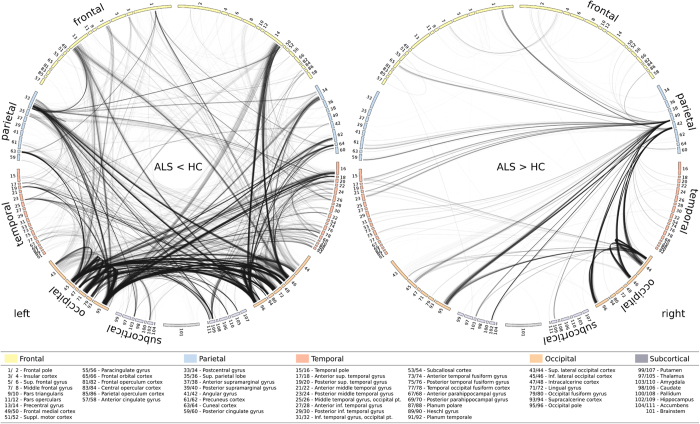
Figure 2. Between-group differences in connectivity: connectograms.
ALS-related functional connectivity changes are illustrated at the level of individual voxel pairs using connectograms. Each circular segment corresponds to a region from the Harvard-Oxford atlas. Each voxel was assigned a unique position on the segment of its comprising region using multidimensional scaling based on the pairwise similarity of the voxels’ connectivity profiles with respect to Gt. A link connecting two voxels indicates significantly decreased (left) or increased (right) functional connectivity in ALS (FDR < 0.05).

