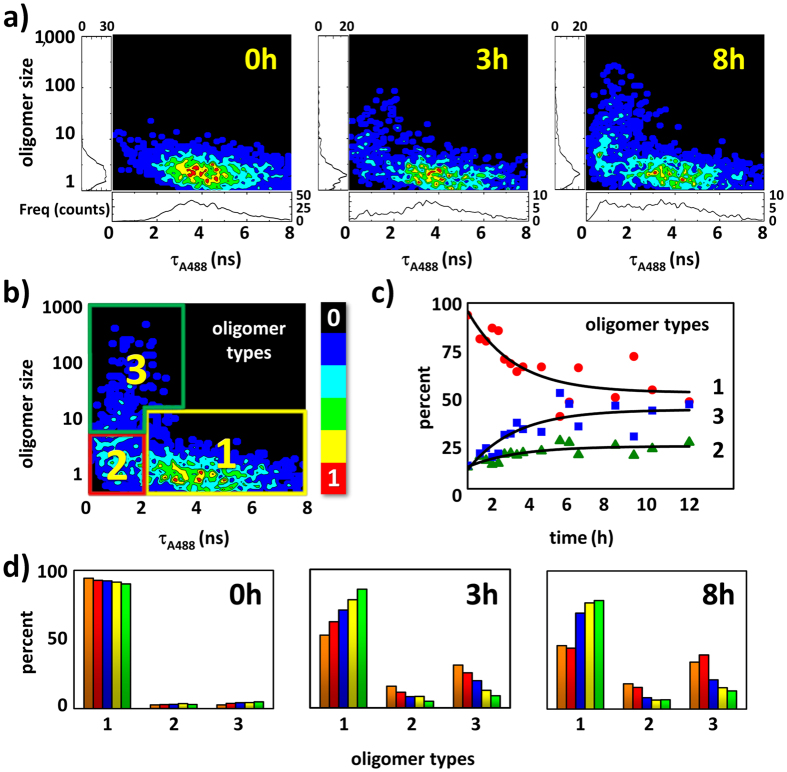
Figure 2. Single-molecule experiments on incubated N47A-SH3-DA.
(a) Oligomer size vs. τA488 single-molecule correlograms from 32 μM samples after 0, 3, and 8 h of incubation. (b) Definitions of the three types of oligomers: 1, 2, and 3. (c) Time trace of the relative populations of each type of oligomer (1, 2, and 3) from the incubated 32 μM samples. (d) Relative populations of the oligomers after 0, 3, and 8 h of incubation of the samples at total protein concentrations of 44 (orange), 32 (red), 28 (blue), 24 (yellow), and 20 μM (green).

