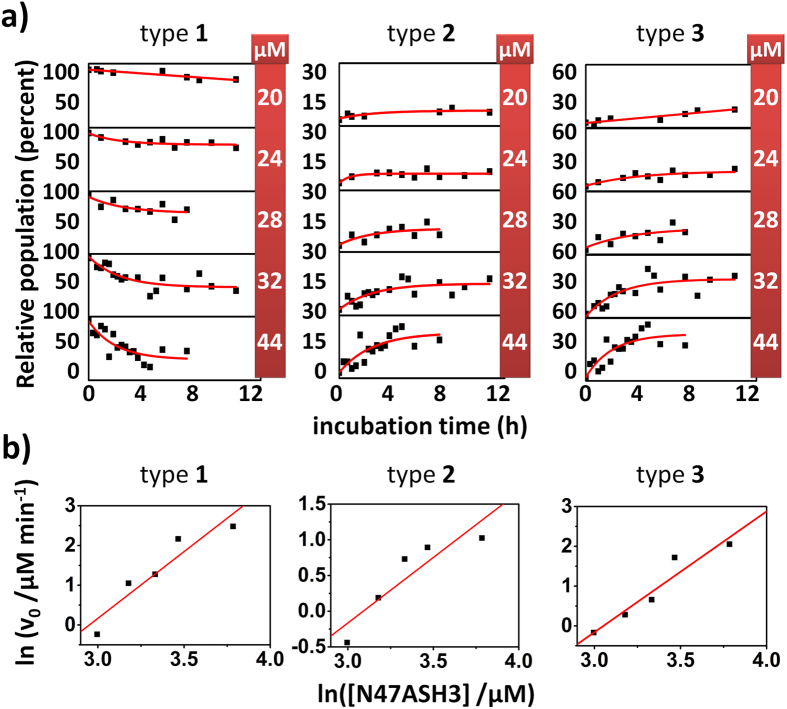
Figure 3. Kinetic study of each type of oligomer using the initial rates method.
(a) Time evolution of the relative populations of types 1, 2, and 3 oligomers at total N47A-SH3-DA concentrations of 20, 24, 28, 32 and 44 μM. The red lines represent the fits using single exponential functions. The data points are derived from three independent incubations. (b) Initial rates, v0, of the disappearance (type 1) and formation (types 2 and 3) of oligomers as a function of the total protein concentration, on the logarithmic scale. The red lines represent linear fits.

