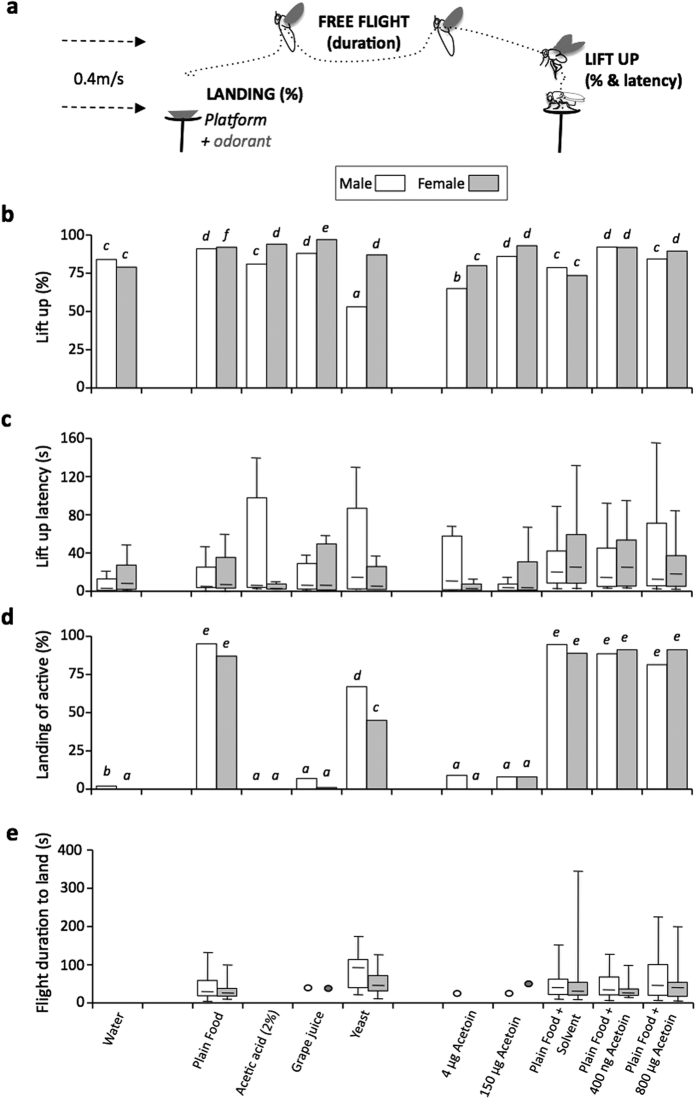
Figure 1. Free-flight of D. melanogaster flies of the Cs strain to various odorant stimuli.
(a) Schematic representation of free-flight in the wind tunnel. The four flight features measured are: lift up frequency, lift up latency, flight duration and landing frequency; The wind speed is indicated on the left. Histograms and box- whisker plots below (b–e) represents these four parameters of free-flight in mature male and female flies (empty and shaded bars, respectively). “Frequency data” are shown as histogram bars whereas “duration data” are shown as box-whisker plots. Each bar of the box-plot represents the 50% median data (or second and third quartile; the median value is shown as a small horizontal bar) while the two thin vertical bars (“whiskers”) down and up the box represent the 25% lower and 25% higher data distribution (fourth and first quartiles), respectively. (b) The frequency of lifting-up, (c) the lift-up latency and (d) among flying insects, the proportion of flies landing on the platform with water and (e) their flight duration between lift-up and landing. Free-flight was measured toward water, plain laboratory food, acetic acid, grape juice, yeast, acetoin alone or mixed with plain food) at two concentrations, and the solvent used for acetoin. The difference between lift-up and landing frequencies were tested with a Fisher exact test, whereas time durations (for the lift-up latency and flight duration) were assayed with a Kruskall-Wallis test. For each parameter, significant differences are indicated by different letters at level p = 0.05. N = 23–38, except for males and females to water (61–65) and for males to 150 μg acetoin (14).

