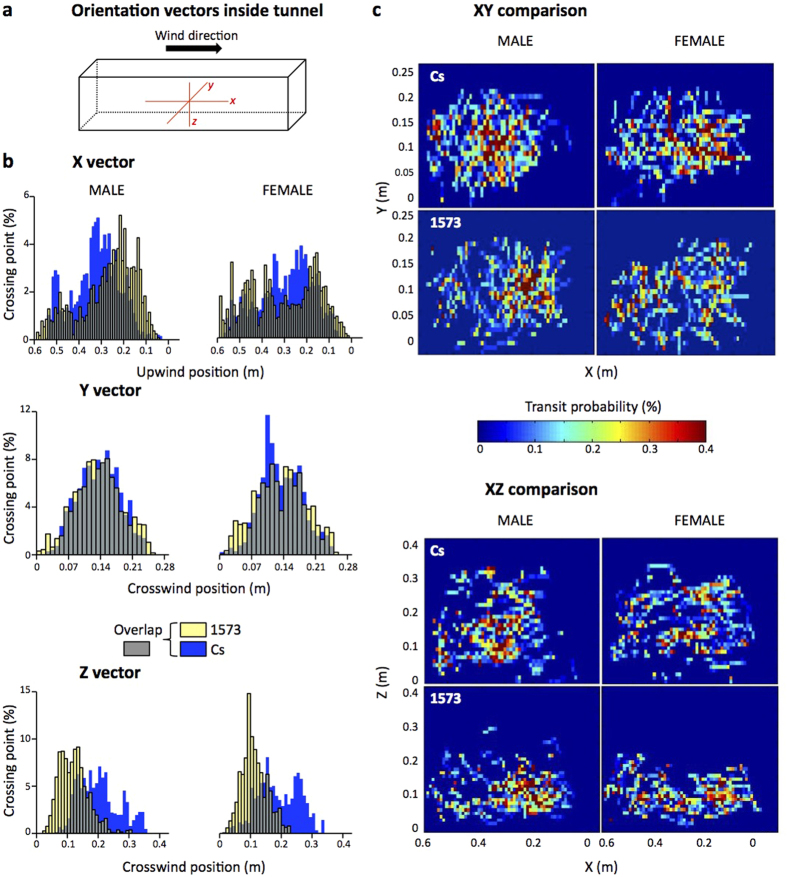
Figure 4. Three-dimensional distribution of flies in the wind tunnel during free-flight to plain food.
(a) During flight, the distribution of flies was computed according to each axis of the wind tunnel: X = length, Y = width, Z = height. (b) For each sex (male = left; female = right) and genotype (Cs control flies = blue; 1573 mutant = yellow; overlap = grey), histograms represent the unidimensional probability to find a fly on each axis (vector). On X axis, a reduced upwind position (close to “0”) indicates the proximity to the point of release (and lift-up). For the Y and Z axis, the medium point of the axis (0.14 and 0.2 m) represents the middle width and height into the tunnel, respectively. (c) The two-dimensional heat map representations reflect the probability to find a fly in the tunnel according to XY (top) and XZ (bottom) 2D-plots. The responses of males and females (left and right, respectively) of the control and mutant genotypes (top and bottom, respectively) were compared to plain food. N = 23–41 (For the response to water, see Supplementary Fig. S3).

