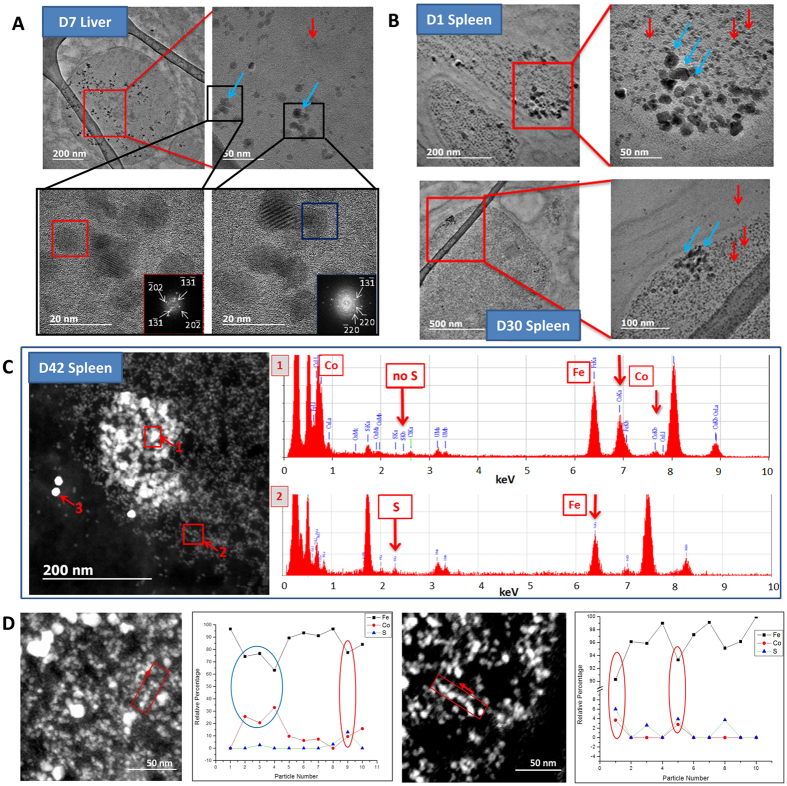
Figure 2. TEM tracking and EDX nano analyses of CoIONPs and ferritins in liver and spleen at different time-points after intravenous injection of CoIONPs.
(A) CoIONPs are identified in the lysosomes of liver macrophages at day 7, by their characteristic size distribution (8.7 ± 2.9 nm) and inverse spinel structure of cobalt ferrite, determined from the FFT of the HRTEM pictures (red and blue squares). (B) CoIONPs (blue arrows) are seen in the neighborhood of numerous HoloF proteins (red arrows) in spleen lysosomes at day 1 (top images) and at day 30 (bottom images). (C) STEM-HAADF micrograph of intralysosomal CoIONPs in spleen at day 42 post injection. The 10 nm monodisperse bright particles (labelled 3) are antiferritin immunogold particles. The less bright and polydisperse particles (square “1”) are the native CoIONPs with a Fe:Co ratio of 2 to 3 and absence of sulfur, as determined by EDX analysis. The small quasi-monodisperse particles correspond to HoloF, characterized by the colocalization of iron and sulfur (Fe:S ratio of about 20). (D) Single particle EDX analyses on spleen samples at day 42 post-injection. The graphs on the right of the STEM-HAADF picture show the relative percentage of Fe, Co and S determined from the point by point EDX analysis of the red quadrant scanned in the arrow direction. Blue oval depicts a native CoIONP particle, while red ovals indicate colocalization of cobalt, iron and sulfur, indicating cobalt uptake by ferritins.

