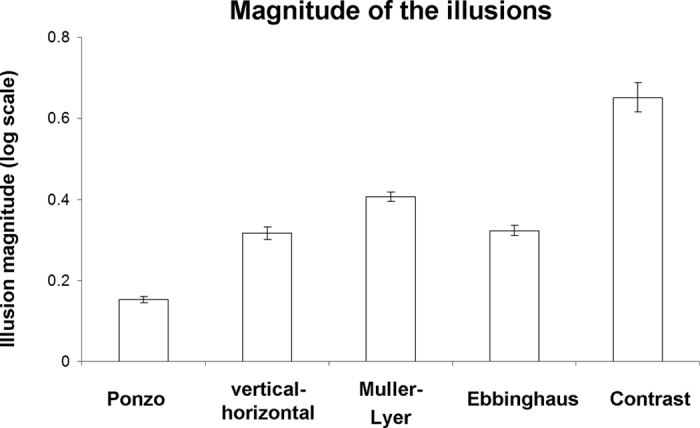
Figure 2. Illusion magnitudes (behavioral results).

The illusory magnitude values reflect the binary logarithm (base 2) of the ratio between perceptual estimation and the real stimulus dimension (for geometrical illusions) or brightness (for contrast illusion). Values above zero reflect an illusory effect. Note, that illusory effects were found for all the illusions. Error bars denote standard error of mean. Individual illusory magnitude values can be found in Fig. 4.
