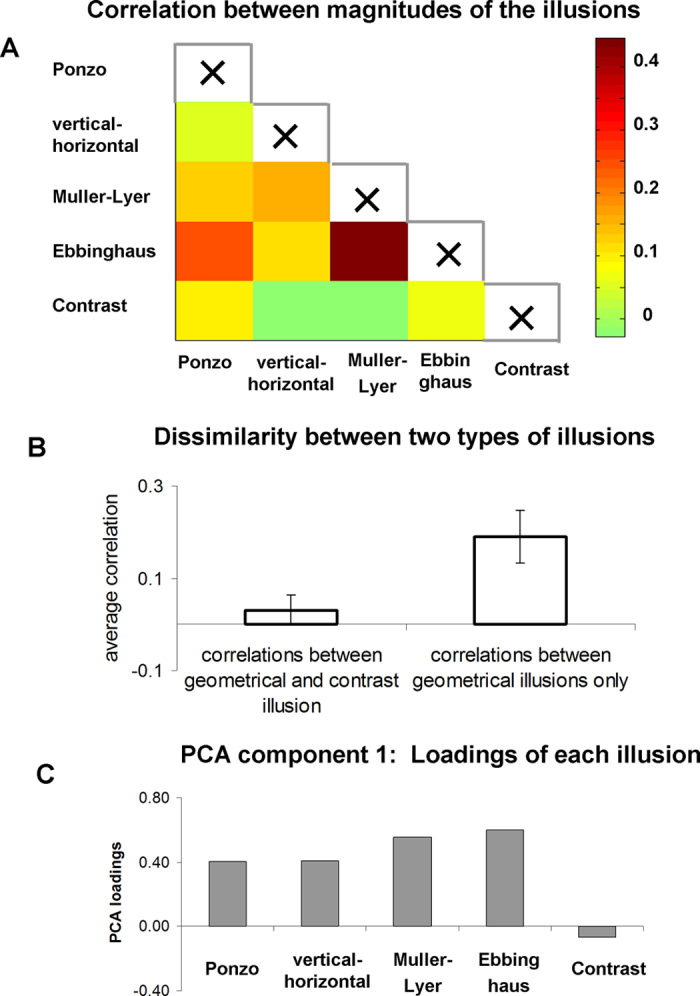
Figure 3. Similarity between illusions (behavioral results).

(A) Correlations between magnitudes of the illusions across participants (Spearman correlation). Note that 1) the correlations between geometrical illusions was on average higher than correlations between geometrical illusions and contrast illusion; and 2) the strongest correlation was found between the Muller-Lyer and Ebbinghaus illusion. The scatter-plots of these correlations are shown in Fig. 4. (B) Comparison of average correlations of magnitudes of the illusions among the geometrical illusions (right), and between geometrical and contrast illusion (left). Note a clear difference between the two groups. Error bars denote standard error of mean. (C) Loadings of each illusion for the first PCA component that explained 36% of the total variance. Note a clear dissociation between geometrical and contrast illusions. The sign of the PCA loadings is arbitrary.
