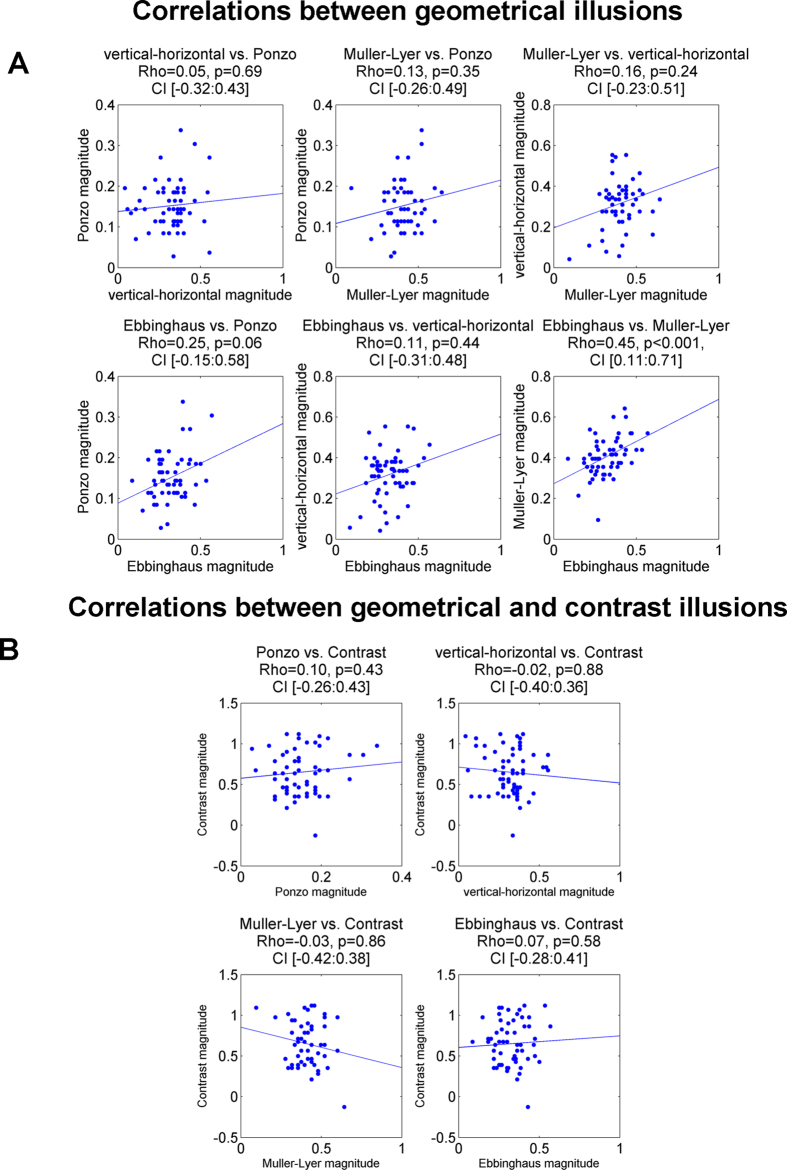
Figure 4. Scatter plots of correlations for all illusion pairs.
(A) Correlation between illusory effects of geometrical illusions. Note the significant correlation between the Muller-Lyer and Ebbinghaus illusions. (B) Correlations between the illusory effects of the geometrical and the contrast illusions. The dots denote individual magnitude for corresponding illusion. The tendency lines were obtained as an ordinary least squares (OLS) fit. Statistical results are Rho of Spearman correlation, permutation p-values and 99.5% confidence interval using permutation analysis.

