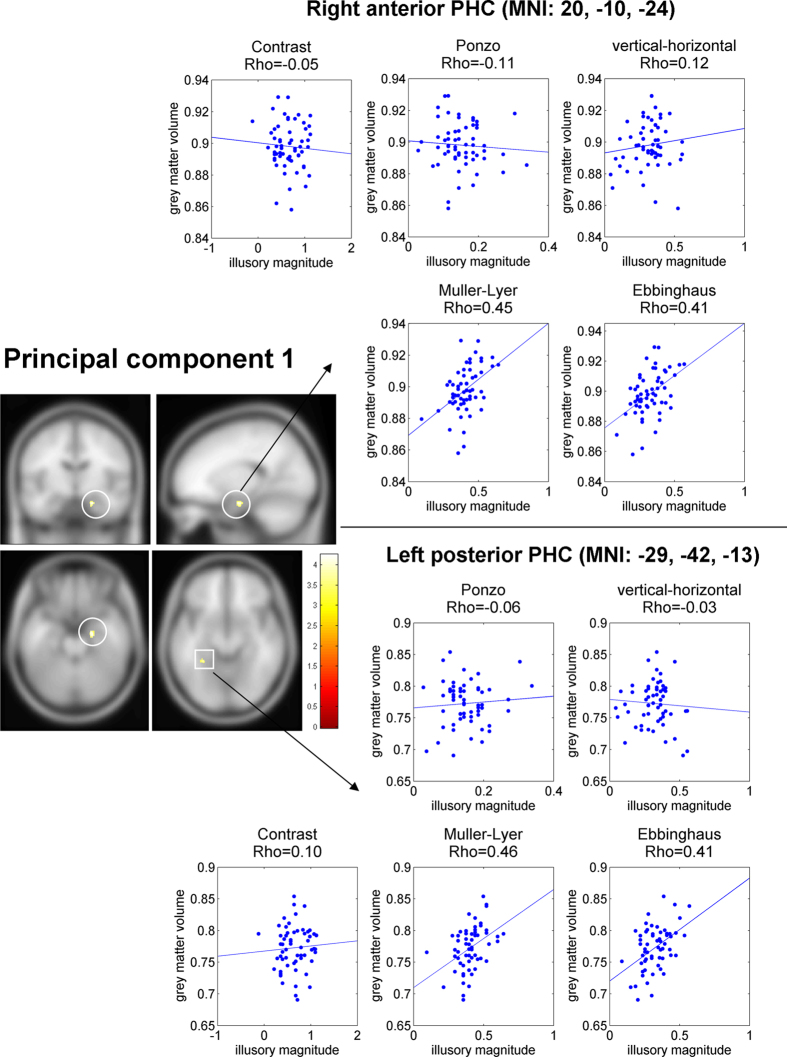
Figure 5. Result of VBM analysis for the first PCA component of the illusory magnitude and ROI correlation analyses for the significant clusters.
Left: Two clusters in the right anterior parahippocampal cortex (PHC) and the left posterior PHC showed a significant correlation between local gray matter density and magnitude of first PCA component (p-value < 0.05, corrected). Right: scatter plots of correlation between gray matter density and illusory effect for the two clusters in the right anterior PHC and the left posterior PHC for four geometrical illusions. Each dot corresponds to an individual participant. Note, that because the behavioral values used for identifying the cluster (i.e., principal component of illusory magnitude) and behavioral values in the correlation (i.e., individual illusions magnitudes) were partially dependent, we did not conduct statistical inference of these correlations (i.e., no p-value or confidence interval was calculated). These correlations are presented only for visualization. Note the high correlation for the Ebbinghaus and Muller-Lyer illusions in both clusters. MNI coordinates of the clusters denote cluster center of mass.

