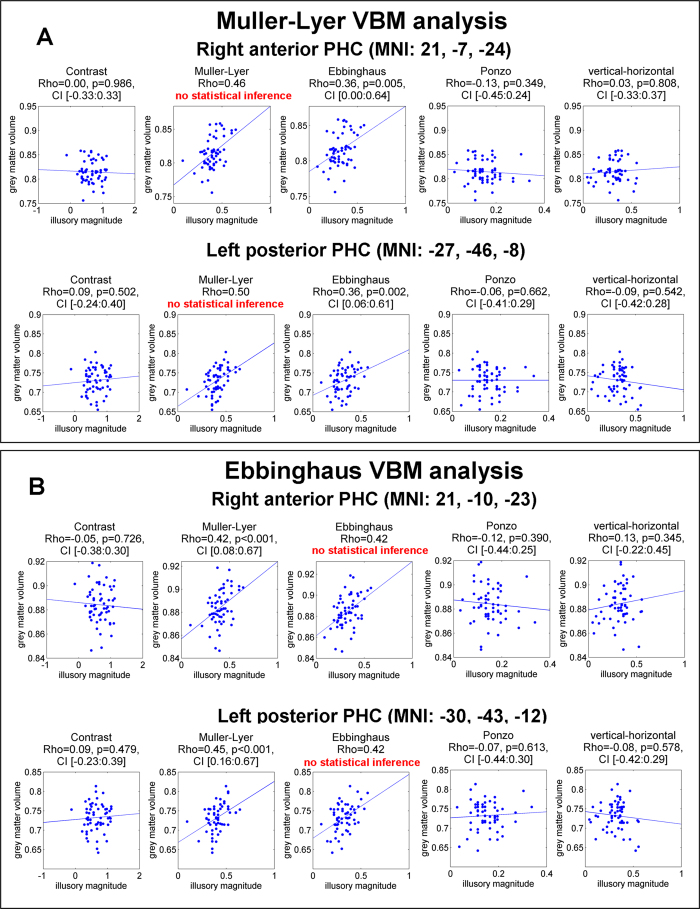
Figure 6. Scatter plots of ROI correlation between gray matter density and illusory magnitude for five illusions in the clusters that were identified using VBM analysis.
(A) Correlations for clusters that were identified using Muller-Lyer illusion. No statistical inference was conducted for the Muller-Lyer illusion because the same data were used for identifying the cluster. The non-independent correlations are presented only for visualization. Note the high and statistically significant correlation for the Ebbinghaus illusion in both clusters. (B) Correlations for the clusters that were identified using Ebbinghaus illusion. No statistical inference was conducted for the Ebbinghaus illusion, because the same data were used for identifying the cluster. The non-independent correlations are presented only for visualization. Note the high and statistically significant correlation for the Muller-Lyer illusion in both clusters. Statistical results are Rho of Spearman correlation, permutation p-values and 99% confidence interval using permutation analysis.

