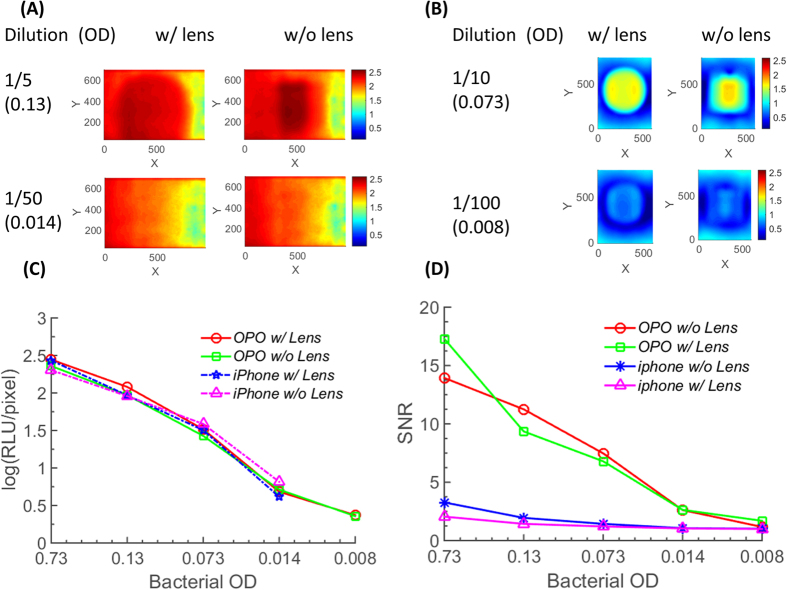
Figure 6. Bioluminescence detection from P. fluoresecens M3A strain with BAQS.
(A) Representative luminescence image for 1/5 and 1/50 dilution sample for iphone 5 s. (B) Representative luminescence image for 1/10 and 1/100 dilution sample for OPO. Data were captured with and without lens (f = 25 mm, plano-convex) for comparison. Color scale bar is in logarithmic scale, and the best performance setup (diffusive chamber, lens, integration time of 60 seconds, 3 consecutive shots, and NREA algorithm) was used for data acquisition. (C) Estimated RLU/pixel for diluted bacterial samples for both phones. (D) SNR of the experimental data. Noise intensity was calculated by spatially filtering and averaging pixel intensity outside the signal area.

