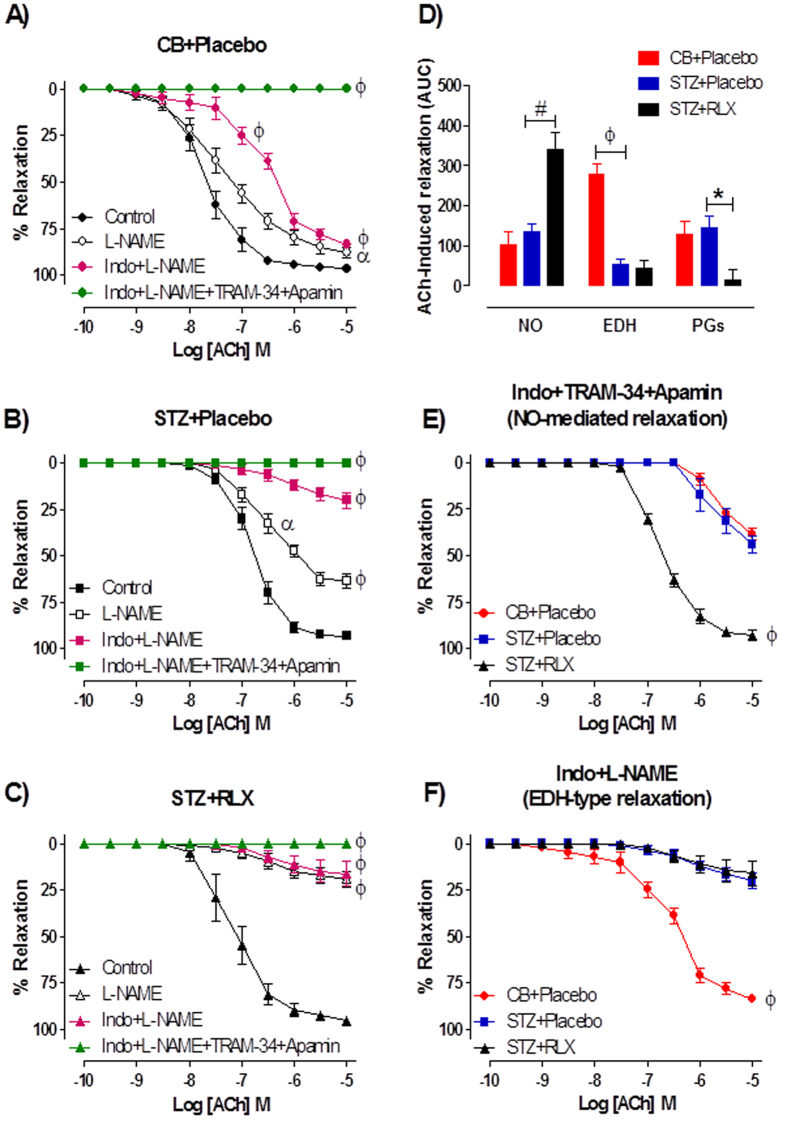
Figure 4.
Cumulative dose-response curves to ACh in the absence (control) or presence of the NOS inhibitor, L-NAME (200 μM), indomethacin (1 μM) + L-NAME or the combination of TRAM-34 (1 μM) + apamin (1 μM) + indomethacin + L-NAME in the mesenteric arteries of (A) CB + Placebo, (B) STZ + Placebo and (C) STZ + RLX treated mice. (D) Area under curve of ACh-induced relaxation reveals the relative contribution of NO, EDH and PGI2 in the mesenteric arteries of CB + Placebo, STZ + Placebo and STZ + RLX treated mice. Cumulative dose-response curves to ACh in the presence of (E) indomethacin + TRAM-34 + apamin and (F) indomethacin + L-NAME in the mesenteric arteries of CB+Placebo (●), STZ+Placebo (■) and STZ+RLX (▲) treated mice. n = 9–12 per group. Data (mean ± SEM) are expressed as % U46619 contraction. Significantly (ϕP < 0.0001, αP < 0.05, #P < 0.001, *P = 0.009) different to STZ+Placebo (comparison across groups) or control (comparison within group).

