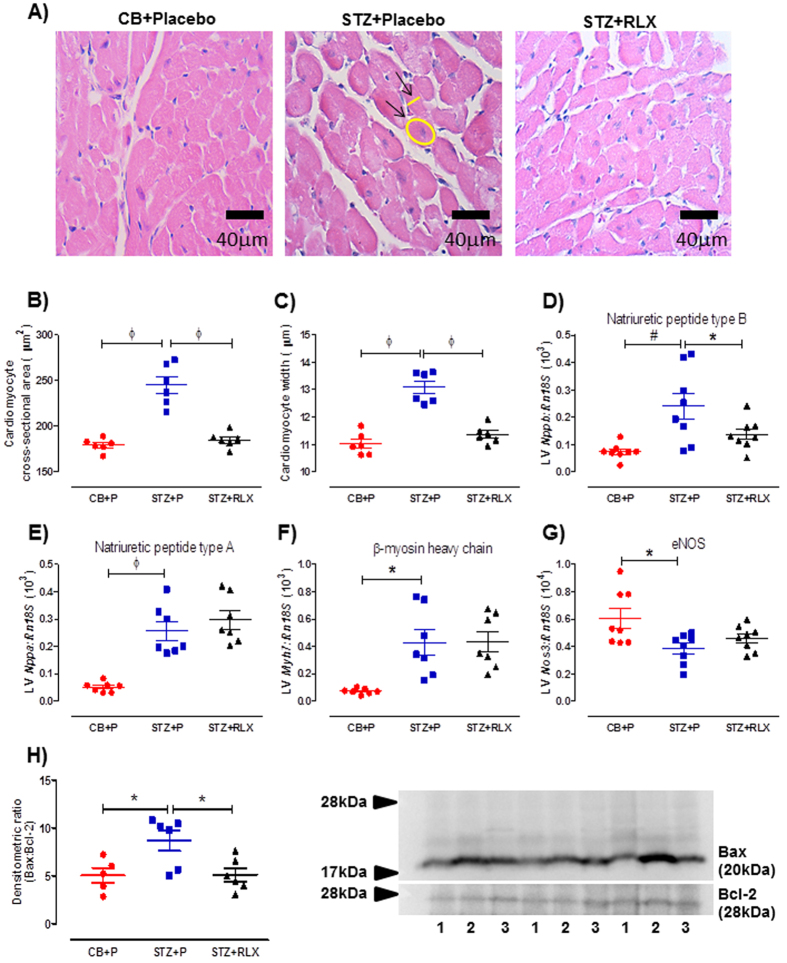
Figure 6.
(A) Representative and quantification of (B) cardiomyocyte cross-sectional area and (C) width of H&E-stained cardiomyocytes in the LV of CB+Placebo, STZ+Placebo and STZ+RLX treated mice. Arrows indicate an example of cardiomyocyte cross-sectional area and width measurements. Gene expression of (D) natriuretic peptide type B (Nppb), (E) natriuretic peptide type A (Nppa), (F) β-myosin heavy chain (Myh7) and (G) endothelial nitric oxide synthase (Nos3) in CB+Placebo, STZ+Placebo and STZ+RLX treated LV. Gene expression is normalised to the reference gene Rn18S and presented as mean ± SEM 2−∆Ct values x 103 or 104 (Nos3). (H) Quantification and representative Western Blot of Bax/Bcl-2 protein expression in the LV of CB+Placebo (denoted by 1), STZ+Placebo (denoted by 2) and STZ+RLX (denoted by 3) treated mice. n = 6–8 per group. Significantly (ϕP < 0.0001, #P = 0.002, *P < 0.05) different to STZ+Placebo.

