Figure 7.
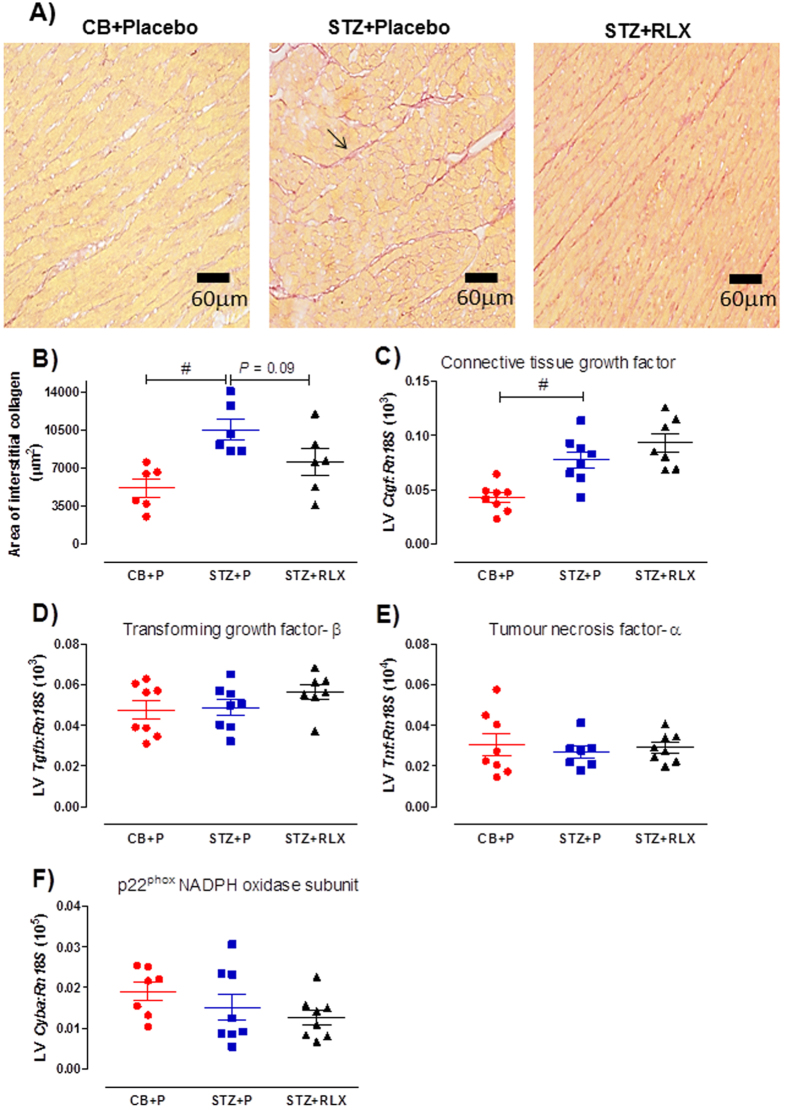
(A) Representative and (B) quantification of Picrosirius red-stained interstitial collagen in the LV of CB+Placebo, STZ+Placebo and STZ+RLX treated mice. Arrow indicates an example of interstitial collagen. Gene expression of (C) connective tissue growth factor (Ctgf), (D) transforming growth factor-β (Tgfb), (E) tumour necrosis factor-α (Tnf) and (F) p22phox NADPH oxidase subunit (Cyba) in CB+Placebo, STZ+Placebo and STZ+RLX treated LV. Gene expression is normalised to the reference gene Rn18S and presented as mean ± SEM 2−∆Ct values x 103 (Ctgf, Tgfb), 104 (Tnf) or 105 (Cyba). n = 6–8 per group. Significantly (#P < 0.01) different to STZ+Placebo.

