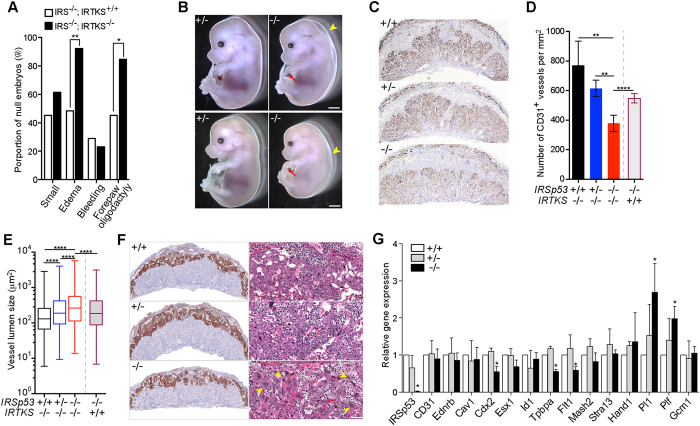
Figure 5. IRTKS functionally overlaps with IRSp53 in placental development.
(A) Analysis of overt phenotypes in E14.5 IRSp53 knockout embryos in IRTKS+/+ (n = 31) or IRTKS−/− (n = 13) background. *p < 0.05, **p < 0.01, z-score test for two population proportions. (B) E14.5 IRSp53+/−; IRTKS−/− and IRSp53−/−; IRTKS−/− embryos. Arrowheads point to the severe subcutaneous edema and arrows point to the lack of posterior digits in the right forepaw of the dKO mutants. Scale: 0.5 mm. (C) Labyrinth vasculature revealed by CD31 immunostaining in E14.5 placentas. (D) Number of CD31+ vessels per unit area in E14.5 placentas. Three placentas were analysed for each genotype. The IRSp53−/−;IRTKS+/+ results included for comparison. Error bars = s.d. **p < 0.01, ****p < 0.0001, two-tailed t-test. (E) Measurement of lumen size of CD31+ blood vessels in E14.5 placentas. Whiskers mark maximum and minimum values. Three placentas were analysed for each genotype. The IRSp53−/−;IRTKS+/+ results included for comparison. ****p < 0.0001, two-tailed t-test. (F) In situ hybridization for Tpbpa reveal spongiotrophoblast organization in E14.5 placentas of IRSp53 +/+, +/− and −/− in IRTKS−/− background. Right panels show the spongiotrophoblast layer in H&E sections at higher magnification. Patches of trophoblast giant cells (yellow arrowheads) were observed in the spongiotrophoblast layer of double KO placentas. Scale: 100 μm. (G) Expression of marker genes in E14.5 placentas measured by qPCR. Values normalized to Tbp, plotted relative to IRSp53+/+;IRTKS−/− placenta. Error bars = s.d. of 3 independent sets of placentas, *p < 0.05 paired t-test.

