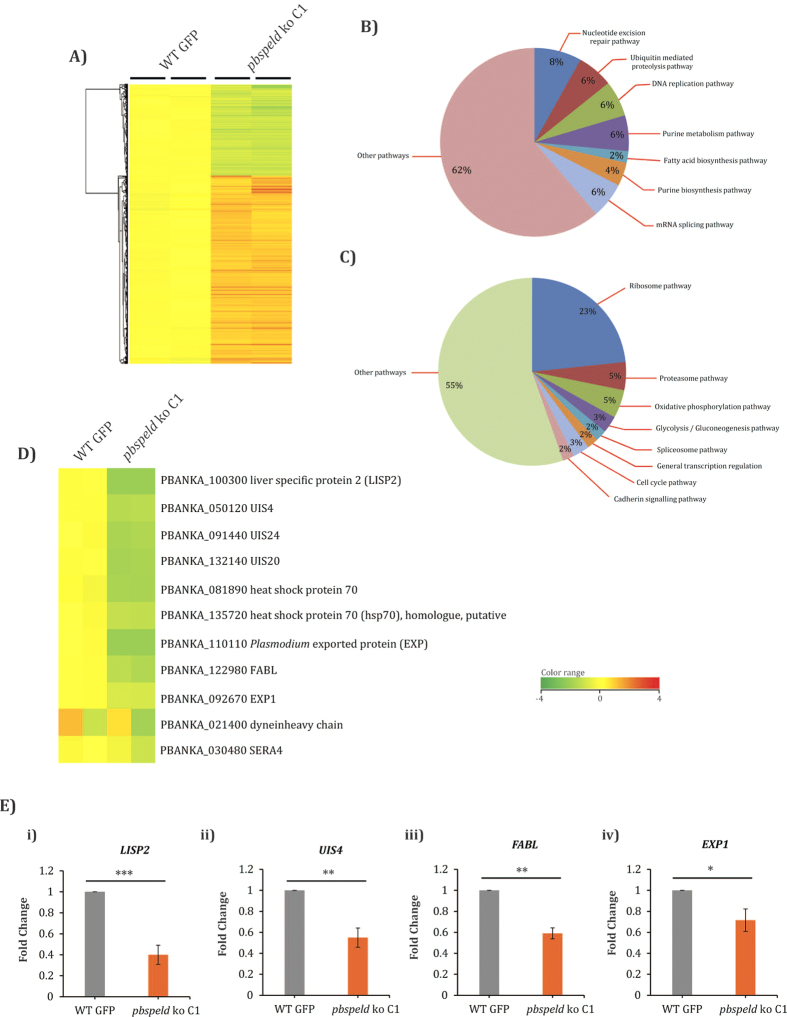
Figure 5. Microarray of 36 hrs liver stages of WT and pbspeld ko.
(A) Heat map showing global gene expression changes in P. berghei liver stages at 36 hrs from WT and pbspeld ko. B) Pie diagram indicating the major functional pathways upregulated (B) and downregulated (C) in pbspeld ko. (D) Few of the well characterised liver stage specific genes downregulated in pbspeld ko. The plasmoDB ID of each of these genes with their probable functions are indicated. (E) Quantitative real time PCR showing downregulation of transcripts: LISP2, UIS4, FABL and EXP1 in pbspeld ko. (*p < 0.05,**p < 0.005, ***p < 0.0005 as compared to WT).

