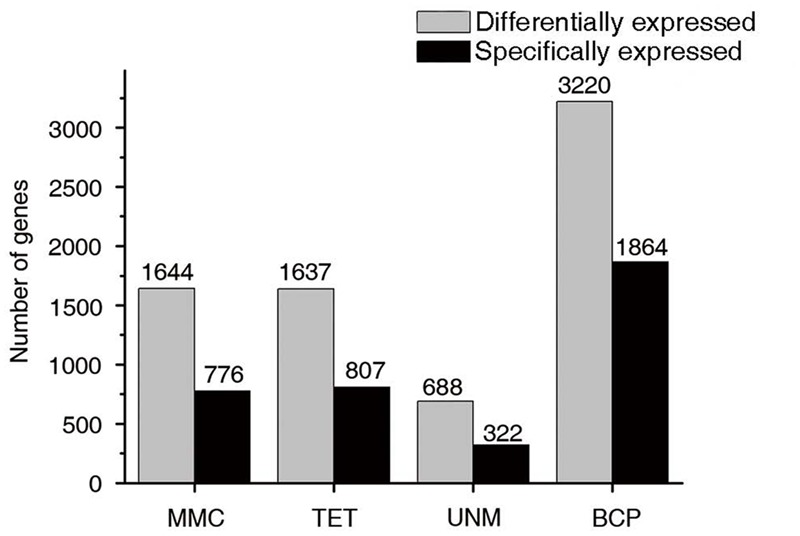
FIGURE 10.

Stage-specifically expressed genes at four developmental stages. The gray bars in this bar graph depict the numbers of differentially expressed genes (genes in groups one to four in Figure 7). The black bars depict the numbers of specifically expressed genes (twofold up-regulated and RPKM value ≥ 10) in each library.
