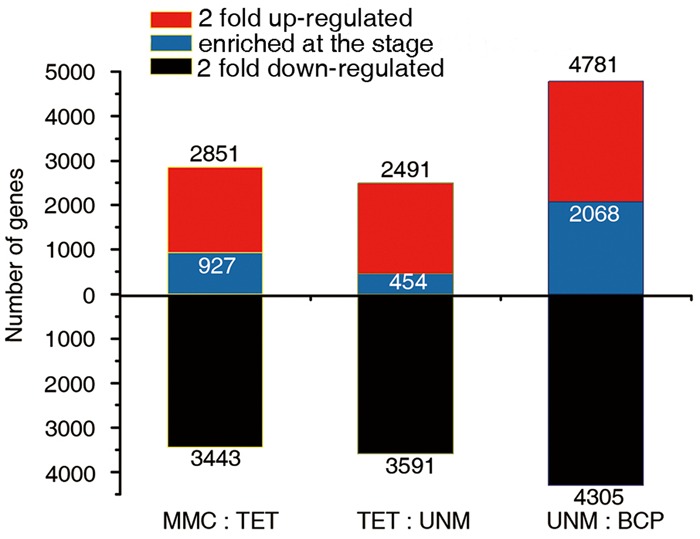
FIGURE 6.

Comparisons of adjacent developmental stages. The DGE libraries of four stages were compared to their preceding stage during anther development. MMC has no reference. The number of genes twofold up-regulated or down-regulated at FDR ≤ 0.001 are plotted on the red or black bars in the graph. Among the up-regulated genes at each stage, the numbers of specifically enriched genes (RPKM value ≥ 10) are plotted on the blue bars.
