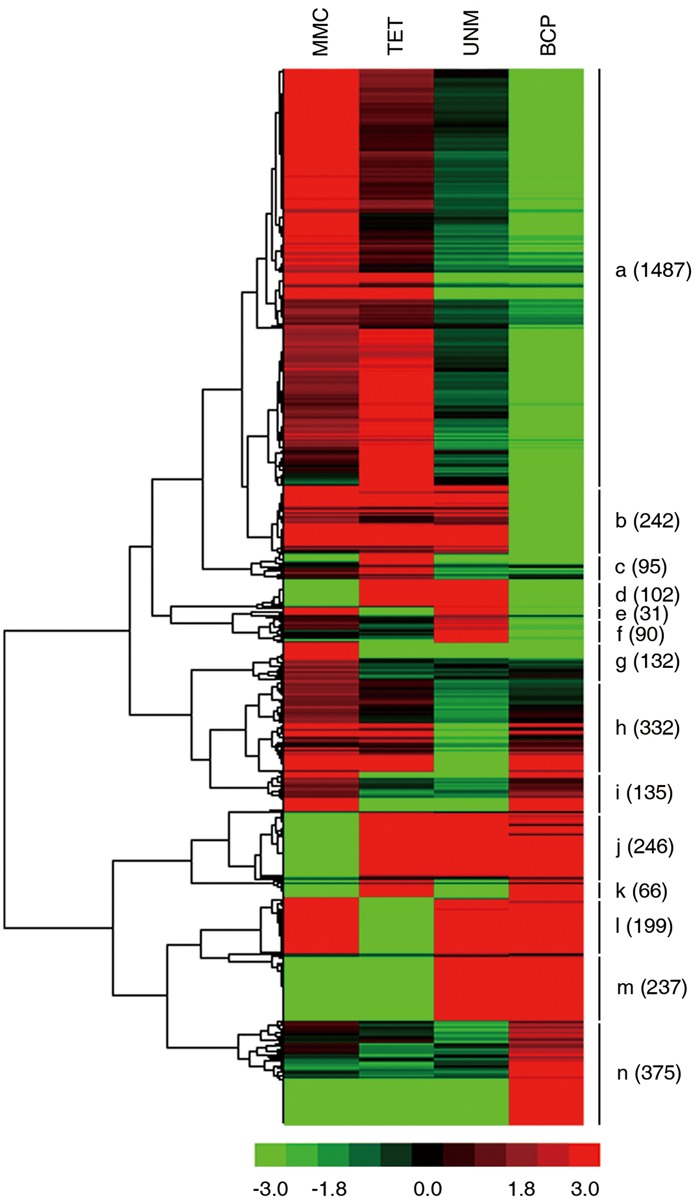
FIGURE 8.

Expression patterns of stage-specifically expressed genes. Hierarchical cluster diagram represents expression patterns of stage-specifically expressed genes of four stages. The numbers of genes under each cluster are showed at the right side.
