
Figure 5.
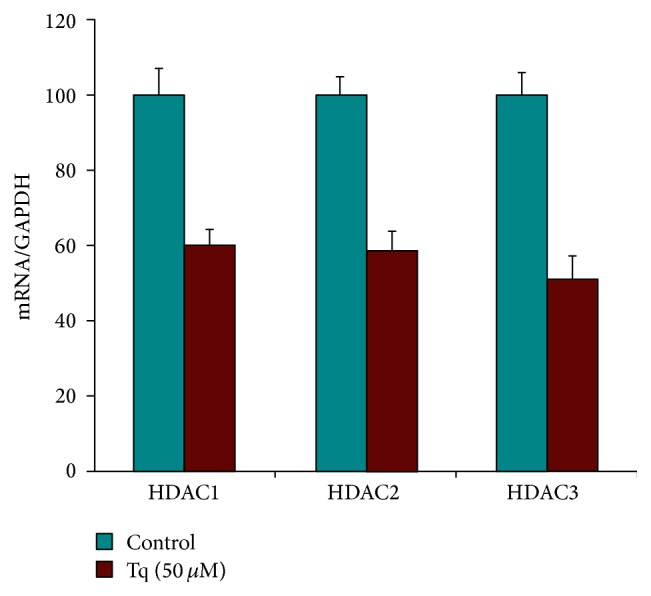
Real time qPCR analysis of MiaPaCa-2 cells showing significant reduction of HDACs 1, 2, and 3 levels upon treatment with Tq (50 μM). ∗P < 0.05 versus control levels, using one-way repeated ANOVA with subsequent all pairwise comparison procedure by Student's t-test.