
Figure 6.
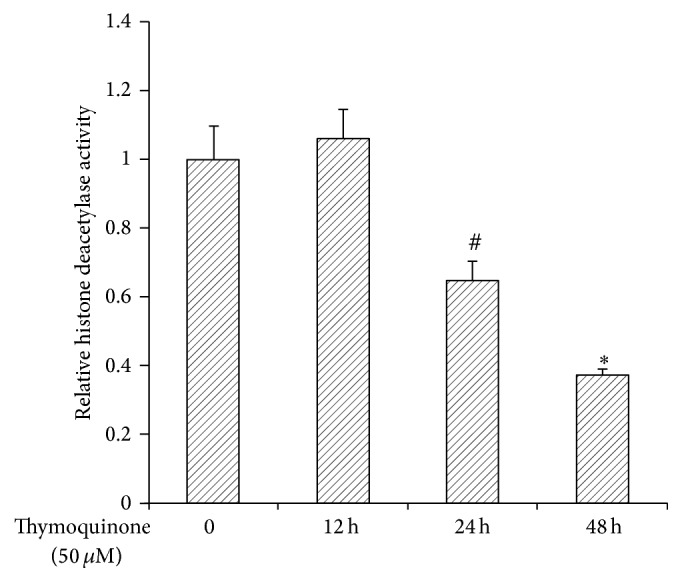
MiaPaCa-2 cells were treated with or without Tq (50 μM) for 12–48 h. HDACs activity decreased significantly at 24 and 48 h. Values are expressed as mean ± standard deviation of three different observations. #P < 0.05 ∗P < 0.002 versus control levels, using one-way repeated ANOVA with subsequent all pairwise comparison procedure by Student's t-test.