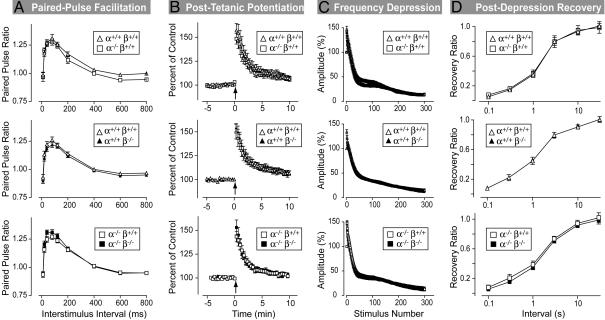
Fig. 4.
Hippocampal synaptic plasticity in α- and β-synuclein single- and double-KO mice. All data are taken from recordings at excitatory Schaffer collateral/CA1 pyramidal cell synapses. (A) Paired-pulse facilitation. Data show the ratio of the second to the first synaptic response (paired-pulse ratio) to two closely spaced stimuli as a function of the interstimulus interval (data are given as number of mice/number of slices; n = 3:9 and 3:8 for α+/+β-/- and WT mice, respectively; n = 1:3 and 2:6 for α-/-β+/+ and WT mice, respectively; and n = 2:5 and 2:6 for α-/-β-/- and α-/-β+/+ control mice, respectively). (B) Posttetanic potentiation. Potentiation was induced by 30 stimuli at 100 Hz (arrow) in 40 μM AP5 (data are given as number of mice/number of slices; n = 3:9 and 3:8 for α+/+β-/- and WT mice, respectively; n = 1:3 and 2:6 for α-/-β+/+ and WT mice, respectively; and n = 2:5 and 2:7 for α-/-β-/- and α-/-β+/+ mice, respectively). (C) Synaptic depression. Synaptic responses during a 14-Hz stimulus train were normalized to the first response (data are given as number of mice/number of slices; n = 3:8 and 3:8 for α+/+β-/- and WT mice, respectively; n = 1:3 and 2:5 for α-/-β+/+ and WT mice, respectively; and n = 2:5 and 2:6 for α-/-β-/- and α-/-β+/+ mice, respectively). (D) Recovery after synaptic depression induced by a 100-Hz stimulus in the presence of AP5 and 5 mM Ca2+ (data are given as number of mice/number of slices; n = 3:12 and 3:12 for α+/+β-/- and WT mice, respectively; n = 1:4 and 2:8 for α-/-β+/+ and WT mice, respectively; and n = 2:8 and 2:8 for α-/-β-/- and α-/-β+/+ mice, respectively). In all graphs, open symbols are placed above filled symbols, and filled symbols are invisible if they precisely coincide with open symbols. All data are given as mean ± SEM.

