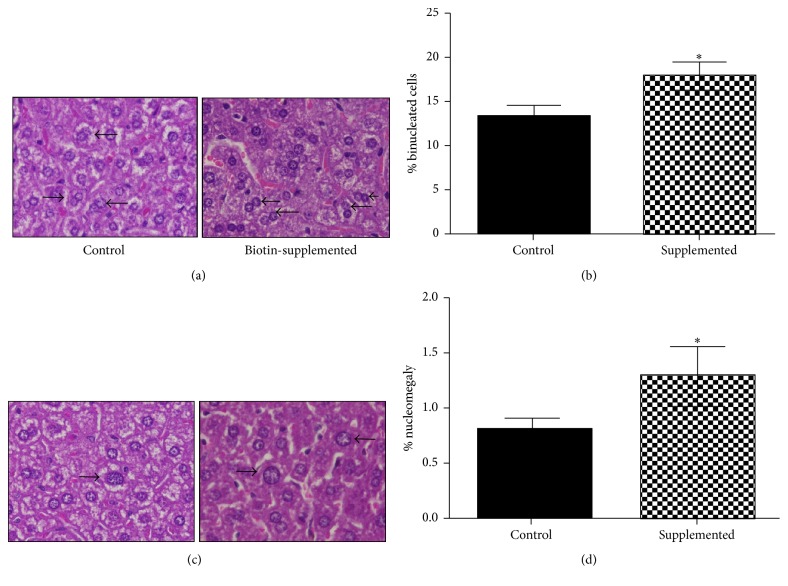
Figure 4.
Effect of biotin supplementation on binucleated hepatocytes and nucleomegaly in mice fed a biotin-supplemented diet for 8 weeks. (a) Hematoxylin and eosin representative image of hepatocytes from control and biotin-supplemented group (right) showing mono and binucleated hepatocytes. (b) Quantification of binucleated hepatocytes per field. (c) Hematoxylin and eosin images of hepatocytes from control and biotin-supplemented group (right) showing nuclei <12 and >12 μm. (d) Nuclei quantification >12 μm per field. Black bars: control group; patterned bars: biotin-supplemented group. Values represent the mean ± SEM of 9 mice per group. ∗ p < 0.050 compared to the control group.

