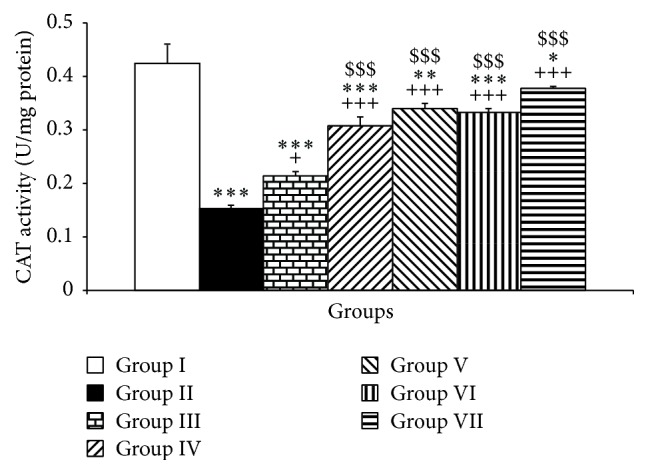
Figure 5.

The effects of PTU, Vit E, pioglitazone, and rosiglitazone on cerebellar CAT. Data are presented as mean ± SEM; n = 7. ∗ P < 0.05, ∗∗ P < 0.01, and ∗∗∗ P < 0.001 versus group I; + P < 0.05 and +++ P < 0.001 versus group II; $$$ P < 0.001 versus group III. The data from different treatment groups were compared by using one way ANOVA followed by post hoc LSD test. Group I (control), the animals received drinking water; group II, the animals received 0.05% propylthiouracil (PTU) in drinking water; besides PTU, the animals in groups III, IV, V, VI, and VII were injected with 20 mg/kg vitamin E (vit E), 10 or 20 mg/kg pioglitazone, and 2 or 4 mg/kg rosiglitazone, respectively.
