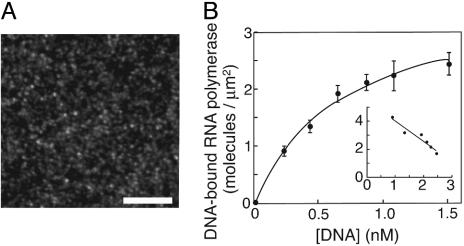
Fig. 2.
Homogeneous DNA-binding activity of the immobilized holoenzyme. (A) Anepifluorescence image of DNA harboring the high-affinity site bound to the fixed holoenzyme. The linearized plasmid pRLG3749 was injected into the chamber on which the holoenzyme had been fixed, incubated for 20 min, and washed with the casein-containing buffer A. The bound DNA molecules were stained with YOYO-1 (Molecular Probes). (Scale bar, 10 μm.) (B) The densities of DNA-bound holoenzyme molecules. The curve is the best-fit hyperbola, C[DNA]/(Kd + [DNA]), where C is the density of active holoenzyme and Kd is the dissociation constant. An excellent fit was confirmed by the linearity of the Scatchard-type plot shown in Inset (DNA-bound RNA polymerase)/[DNA] against (DNA-bound RNA polymerase) in the units of the main graph, which would tend to exaggerate any deviation from a hyperbola. The calculated saturation level, C, was 3.5 ± 0.2 molecules per μm2, and the dissociation constant, Kd, was 0.6 ± 0.1 nM.

