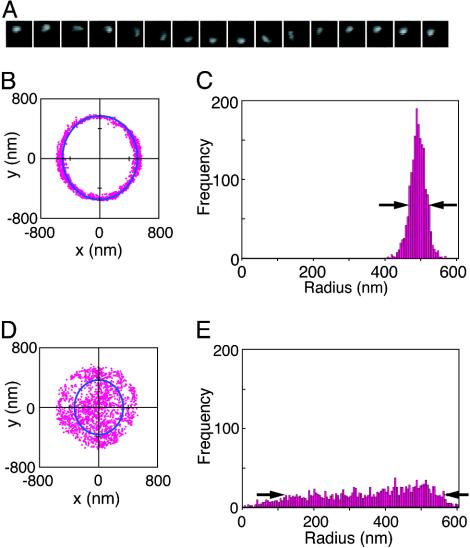
Fig. 3.
Indices of the movements of the beads in two cases. (A) A series of microscopic images of a fluorescent sphere; an example in the standard system covering 1.1 s. (B and D) The 1,800 coordinates (x, y) of the fluorescent sphere during 1 min in the standard system (B) and a control system (D). The movements are shown in Movies 1 and 2. The solid lines are the best-fit ovals. (C and E) Distributions of the polar coordinate r for B and D, respectively. The half-widths are shown by the arrows.

