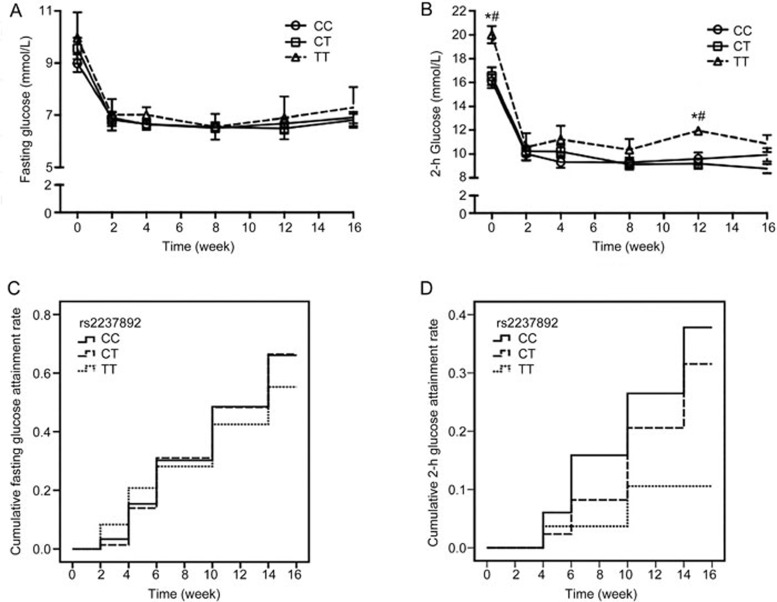
Figure 1.
Association of rs2237892 with fasting glucose and 2-h glucose levels during gliclazide MR treatment. (A and B) Mean fasting glucose and 2-h glucose levels among carriers of the CC, CT, and TT genotypes. The data are presented as the mean±SEM. *P<0.05 between CC and TT genotype carriers; #P<0.05 between CT and TT genotype carriers. (C and D) Associations of rs2237892 with attainment rates of the target values for fasting glucose and 2-h glucose, respectively, among carriers of the CC, CT, and TT genotypes. (C) Plog-rank=0.752, PCox-regression=0.797; and (D) Plog-rank=0.020, PCox-regression=0.019. The PCox-regression values were adjusted for age, gender, and body mass index at baseline.

