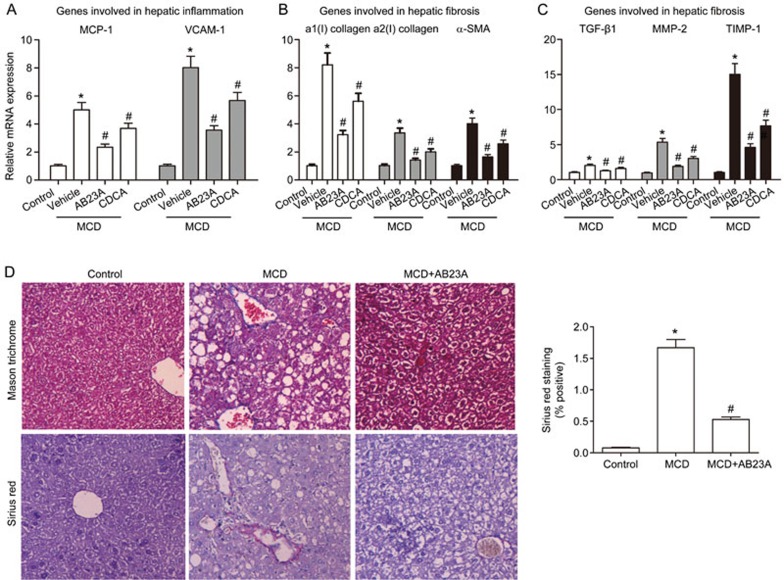
Figure 4.
Effects of AB23A on liver inflammation and fibrosis. (A) Gene expression levels of MCP-1 and VCAM-1, both of which are hepatic inflammatory genes, were determined by quantitative RT-PCR analysis. (B) and (C) Hepatic fibrosis genes: a1(I) collagen, a2(I) collagen, α-SMA, TGF-β1, MMP-2 and TIMP-1, were increased by the MCD diet and were reduced by AB23A treatment. Data are the mean±SD. n=5. *P<0.05 vs control. #P<0.05 vs MCD+vehicle. (D) Masson's Trichrome staining and Sirius Red staining of liver sections (400×magnification). Morphometric analysis of Sirius Red-stained sections. Data are the mean±SD. n=5. *P<0.05 vs control. #P<0.05 vs MCD.

