Figure 1.
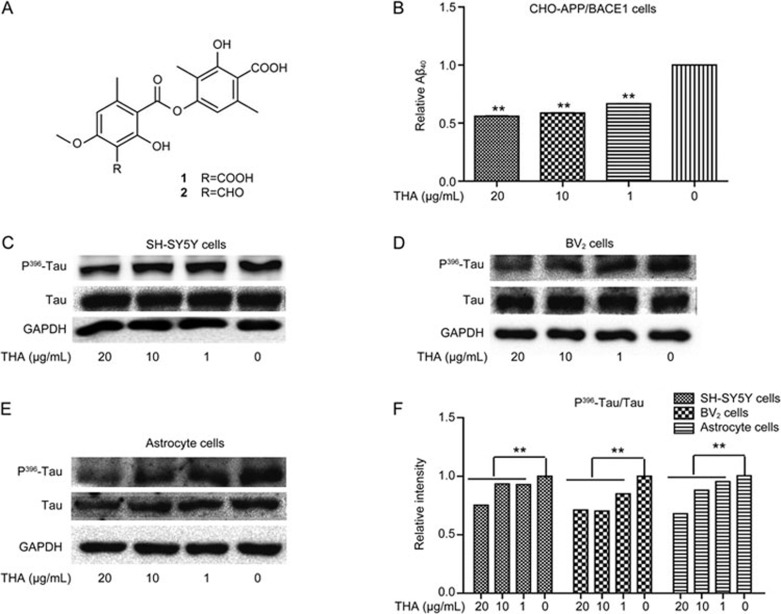
THA inhibited Aβ deposition and Tau hyperphosphorylation. (A) In THA, the contents of squamatic acid (1) and baeomycesic acid (2) are 42% and 46%, respectively. (B) CHO-APP/BACE1 cells were cultured with different concentrations of THA (20, 10, 1, or 0 μg/mL) for 24 h, and Aβ40/sAPPβ levels were detected via ELISA assays of the supernatants. (C–E) Cells were cultured with different concentrations of THA (20, 10, 1, or 0 μg/mL) for 24 h, and P396-Tau was detected by Western blot assays in SH-SY5Y cells (C), BV2 cells (D), and astrocytes (E). (F) Densitometry analysis of Figures C–E. GAPDH was used as a loading control in the Western blot assays. The results were obtained from three independent experiments. Values are the mean±SEM, one-way ANOVA, Bonferroni's multiple comparison test. n=3. **P<0.01 compared with the control group, control group: 0 μg/mL THA treatment group.

