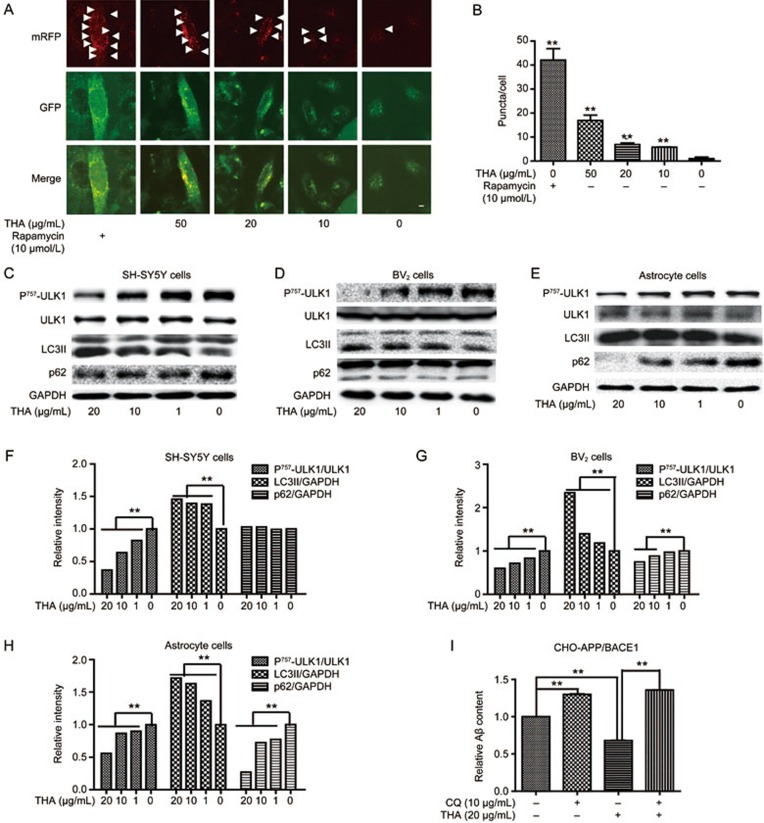
Figure 4.
THA produced Aβ clearance by activating autophagy. (A) CLSM images of SH-SY5Y cells transiently expressing mRFP-GFP-LC3 (Red puncta indicate mRFP, pointed with white arrows). Scale bar: 5 μm. (B) Statistics of image (A) one-way ANOVA, Bonferroni's multiple comparison test. n=3. **P<0.01. (C–H) Cells were cultured with different concentrations of THA (20, 10, 1, or 0 μg/mL) for 24 h, and marker proteins of autophagy, including Unc51-like kinase 1 (ULK1), LC3II and polyubiquitin binding protein p62, were detected by Western blot assays in SH-SY5Y cells (C), BV2 cells (D) and primary astrocytes (E). (F) Densitometry analysis of Figure (C), one-way ANOVA, Bonferroni's multiple comparison test. n=3. **P<0.01. (G) Densitometry analysis of Figure (D), one-way ANOVA, Bonferroni's multiple comparison test. n=3. **P<0.01. (H) Densitometry analysis of Figure (E). GAPDH was used as a loading control in the Western blot assays, one-way ANOVA, Bonferroni's multiple comparison test. n=3. **P<0.01. (I) CHO-APP/BACE1 cells were treated with THA (20 μg/mL), vehicle alone, CQ (10 μmol/L), or THA in combination with CQ for 24 h, and the Aβ levels in the cell culture media were tested by ELISA (t test. n=3. **P<0.01 compared with the control group). The results were obtained from three independent experiments. Values are the mean±SEM. n=3. **P<0.01 compared with the control group, control group: 0 μg/mL THA treatment group.

