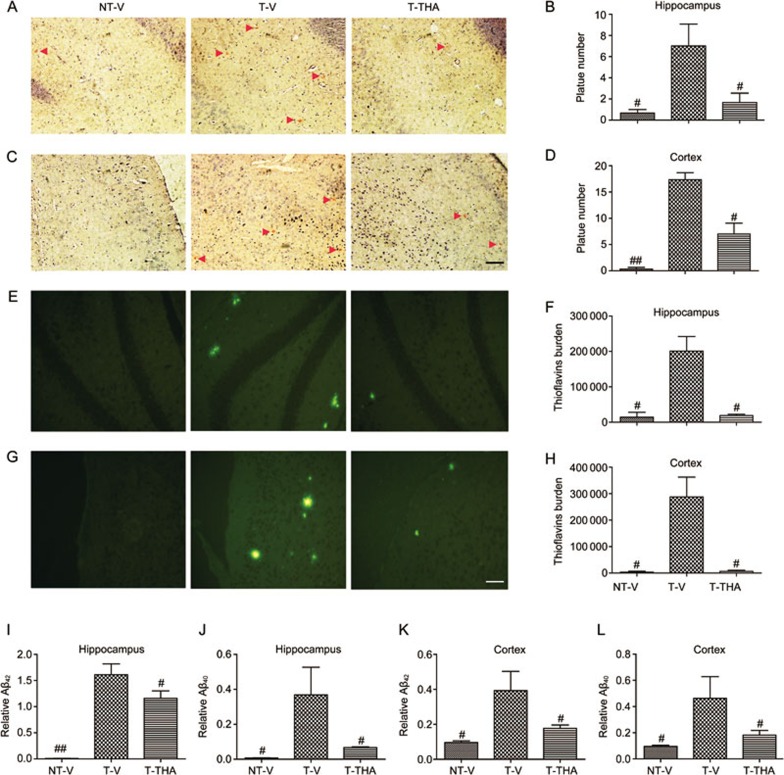
Figure 8.
THA reduced senile plaques in the APP/PS1 transgenic mice. (A) An image of senile plaques stained with Congo red in the hippocampus. Red arrows indicate amyloid plaques. (B) Statistical analysis of image (A). (C) An image of senile plaques stained with Congo red in the cortex; the red arrows indicate amyloid plaques. (D) Statistical analysis of image (C). (E–H) An image of senile plaques stained with Thioflavine S in the hippocampus (E) and in the cortex (G). (F) Statistics of image (E). (H) Statistics of image (G). Scale bar, 100 μm. (I–L) An ELISA assay was used to evaluate the effect of THA on Aβ40/42 levels in the APP/PS1 mice. NT-V, non-transgenic vehicle group; T-V, transgenic vehicle group; T-THA, transgenic mice administration with 300 mg THA/kg per day group. Values are the mean±SEM. t test. n=4. #P<0.05, ##P<0.01 compared with T-V.

