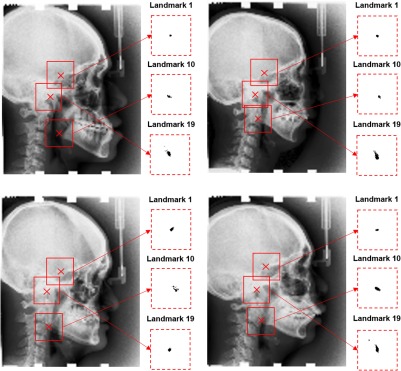
Fig. 4.
Four test images and corresponding estimations of the probability of candidate location being the landmark. The estimations are shown for three example landmarks: L1, L10, and L19. Red crosses in test images denote the ground truth locations of L1 (top), L10 (bottom), and L19 (middle). Inside each red dashed box, the probability of each point being the corresponding landmark is shown by the grayscale color map such that the white corresponds to 0 and black corresponds to 1. The red dashed boxes are centered at ground-truth landmark locations and have a size of .

