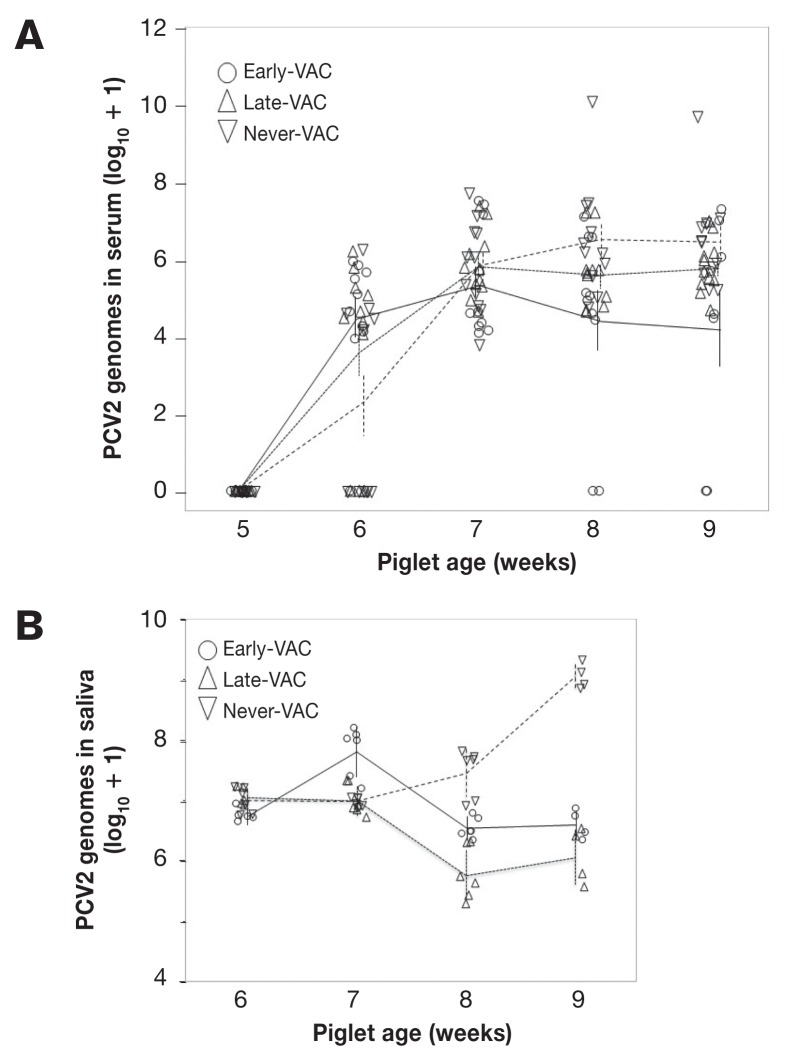
Figure 2.
PCV2 genome load in serum (A) and saliva (B). Viral load is shown for piglets from Early-VAC (○), Late-VAC (△), and Never-VAC (▽) groups. PCV2 genome copy numbers from qPCR are shown as the base-10 logarithm after adding 1 to the original values to demonstrate a base line at 0. Pooled saliva was collected from each group 3 times a week and quantified in duplicate, with the mean qPCR copy number presented for each sample. Vertical bars represent the standard error of the mean (SEM) on a given group at a specific sampling day. Means of each group are connected by a line.

