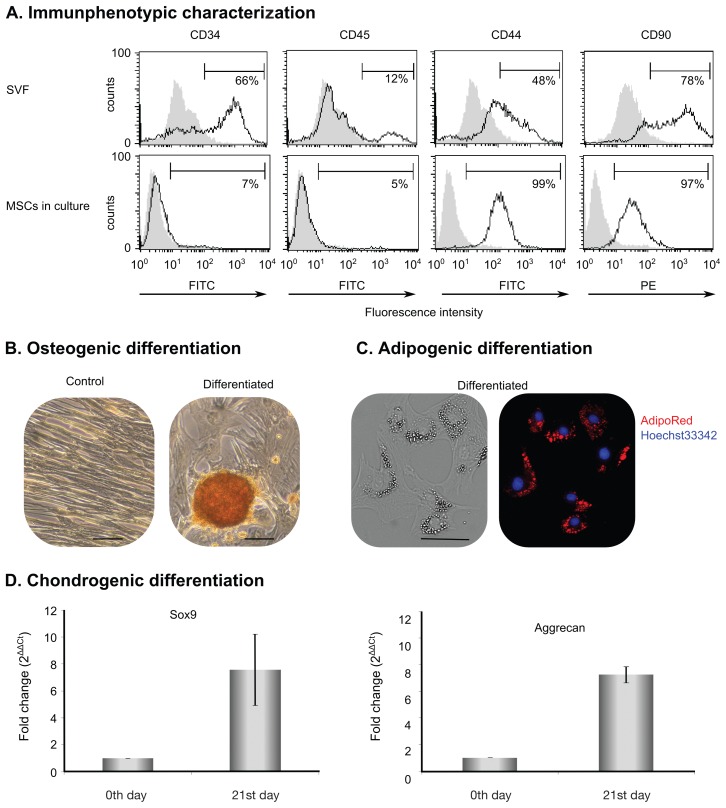
Figure 1.
Characterization of adipose tissue-derived mesenchymal stem cells (AT-MSCs). A — The presence of CD34+, CD45+, CD44+, and CD90+ cells was analyzed in isolated stromal vascular fraction (SVF) (top row) and cultured AT-MSC (bottom row) with flow cytometer. Grey histograms represent control samples without any antibody and black-lined histograms show fluorochrome-conjugated, antibody-stained samples. Percentages indicate the proportion of positive cells to the analyzed surface marker in the cell population. B — Osteogenic differentiation. Extracellular calcium was stained with Alizarin Red S solution. Representative figure shows matrix mineralization in an induced passage 2 cell culture. Original magnification: 200×, scale bar = 500 μm. C — Adipogenic differentiation. Accumulated lipid droplets were stained with AdipoRed (red) and nuclei were dyed with Hoechst 33342 (blue). Original magnification: 100×, scale bar 100 μm. D — Chondrogenic differentiation. Chondrogenic induction was carried out in micromass culture and quantitative polymerase chain reaction (qPCR) was conducted for mRNA expression of Sox9 and aggrecan. Cells on day 0 of micromass induction served as control. Results are expressed as mean ± standard deviation.

