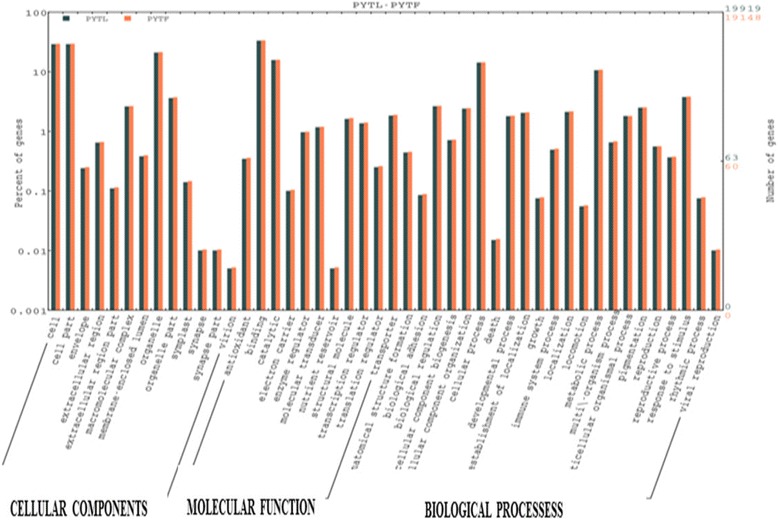
Fig. 2.

Histogram presentation of T. cinerariifolium unigenes among Gene Ontology functional classes. The results are categorized in three main categories: “Cellular component”, “Molecular Function” and “Biological process”. The left y-axis indicates the number of genes in particular category, and the left y-axis indicates the percentage of a specific category of genes in that main category
