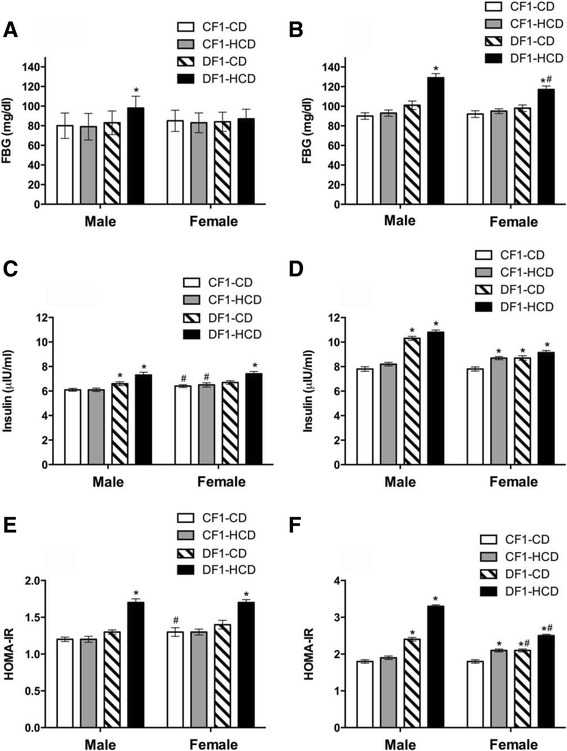
Fig. 1.

Glucose homeostasis parameters for all study groups at the 5th week (a, c and e) and the 30th week (b, d and f). Data are presented as mean ± SEM (n = 10). Abbreviations denote: CF1-CD; F1 offspring of control mothers under CD, CF1-HCD; F1 offspring of control mothers under HCD, DF1-CD; F1 offspring of diabetic mothers under CD, and DF1-HCD; F1 offspring of diabetic mothers under HCD. *Significant different compared to the CF1-CD group by ANOVA (p < 0.05). #Significant different from the males of the same group at the same age by t test (p < 0.05)
