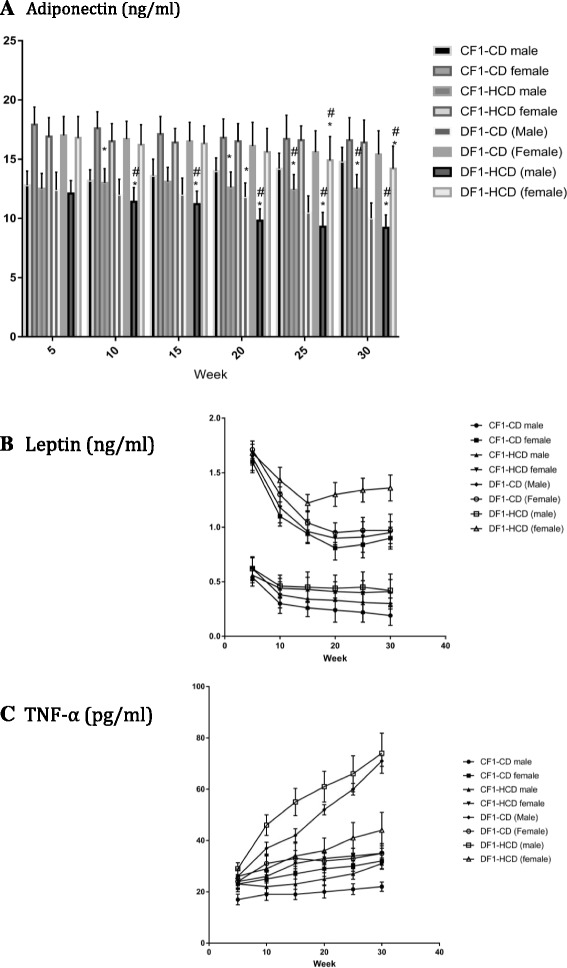
Fig. 5.

Data are presented as mean ± SD (n = 10). Abbreviations denote: CF1-CD; F1 offspring of control mothers under control diet, CF1-HCD; F1 offspring of control mothers under HCD, DF1-CD; F1 offspring of diabetic mothers under control diet, and DF1-HCD; F1 offspring of diabetic mothers under HCD. (*) Significant different from CF1-CD by ANOVA (p < 0.05), (#) significant different from CF-HCD by ANOVA (p < 0.05), and (@) significant different from male at each age by t-test (p < 0.05)
