
Fig. 2.
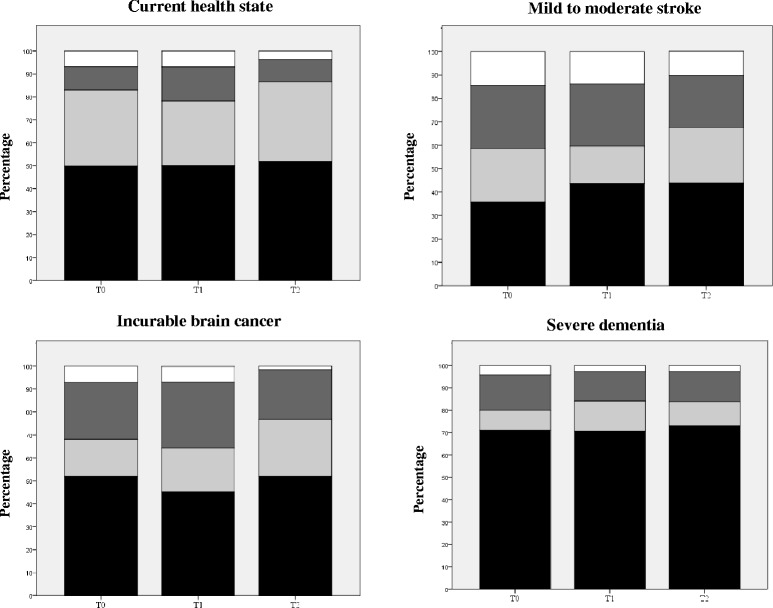
Agreement between older adults and proxies on health-related quality-of-life ratings, for each health state and time point (n = 235 at T0, 188 at T1, and 185 at T2). ■: Identical responses;  = Proxies overestimate by one category;
  = Proxies underestimate by one category; □ : Ratings differ by more than one category