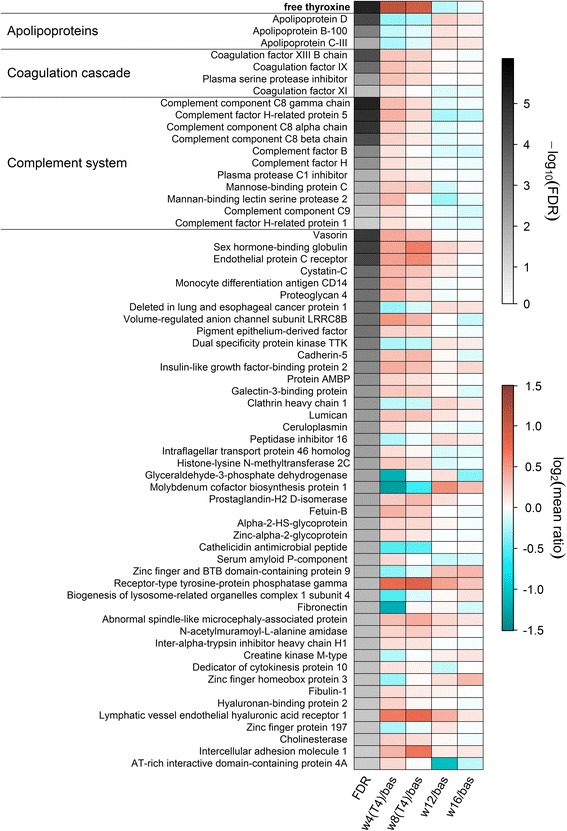
Fig. 4.

Heatmap of plasma proteins significantly associated with free thyroxine (FT4) in mixed effect linear regression models. The first column displays the values of the mean false discovery rate (FDR) for the FT4 effect across 101 subsamples of the data coded in grey color. The other columns indicate the mean log2-ratio from baseline (bas) compared to 4 (w4(T4)) and 8 (w8(T4)) weeks of treatment as well as 4 (w12) and 8 (w16) weeks after finishing the treatment. The time course of FT4 concentrations is shown on the top of the map as reference. Orange shading denotes an increase and blue shading a decrease compared to baseline, respectively. Derived physiological signatures are labeled on the left. The corresponding estimates and FDR values from regression analysis can be found in Additional file 2: Table S2
