Abstract
Background and objectives
The tracing of creatinine (Cr) reference materials to isotope dilution mass spectrometry–assigned values was implemented worldwide to reduce interlaboratory variability and improve assay accuracy. The aims of this study were to examine the current extent of interlaboratory variability and its effect on eGFR.
Design, setting, participants, & measurements
Leftover plasma from 2–3 consecutive days was obtained from 53 intensive care unit patients with a range of kidney functions. Individual patient samples were pooled and split and sent to 12 different laboratories for Cr measurement. For each patient, the mean Cr and Chronic Kidney Disease Epidemiology Collaboration eGFR (eGFR-EPI), assuming a 65-year-old nonblack woman, were determined. Interlaboratory variability was assessed by the range and SD of Cr and eGFR-EPI. This was repeated after stratifying by assay type and by the median Cr of 1.36 mg/dl. For patients whose eGFR-EPI range included 60 ml/min per 1.73 m2, the percentage of laboratories with eGFR-EPI<60 ml/min per 1.73 m2 was determined.
Results
The mean±SD of the Cr and eGFR-EPI ranges were 0.20±0.09 mg/dl and 14±9 ml/min per 1.73 m2 for Cr<1.36 mg/dl. Jaffe Cr results were an average 0.1 mg/dl (Cr≥1.36 mg/dl) and 0.05 mg/dl (Cr<1.36 mg/dl) higher than enzymatic results (P<0.001 for both). Ten patients had an eGFR-EPI range that included 60 ml/min per 1.73 m2. Their median eGFR-EPI range was 15 ml/min per 1.73 m2. There was significant discordance in the diagnosis of CKD (eGFR-EPI<60 ml/min per 1.73 m2), with laboratories using Jaffe Cr methods making the diagnosis more frequently than those using enzymatic Cr methods (60% versus 39%).
Conclusions
Significant interlaboratory variability in Cr measurement still exists. Jaffe assays yield higher Cr values than enzymatic assays, leading to lower eGFR-EPIs and more frequent CKD diagnoses. Further improvements in assay performance are required to standardize patient CKD diagnosis and to facilitate longitudinal Cr monitoring across laboratories.
Keywords: clinical laboratory techniques; African Americans; creatinine; enzyme assays; female; glomerular filtration rate; humans; intensive care units; kidney function tests; renal insufficiency, chronic
Introduction
Kidney function is routinely assessed using serum or plasma concentrations of the endogenously produced creatinine (Cr). Cr is incorporated into equations designed to estimate the GFR (1,2). These estimates of GFR are used to diagnose, classify, and monitor the progression of CKD (1). There are a number of different manufacturers and methodologies commercially available to measure Cr. Interlaboratory variability in Cr assays is well recognized and results in interlaboratory eGFR variability (3–6), with greater effect at lower Cr values due to the inverse relationship between Cr and eGFR.
There are a number of recognized contributors to Cr interlaboratory variability including assay nonspecificity, which differs by assay type (Jaffe versus enzymatic) and manufacturer, heterogeneous reference materials and procedures, different platforms performance characteristics, and others (sample type, preparation, and handling) (4,7,8).
The practice of tracing assay reference materials against isotope dilution mass spectrometry (IDMS)–assigned values has reduced the effect of nonstandardized calibration of Cr assays on assay inaccuracy (5,7). IDMS traceability cannot be expected to improve the effect of assay nonspecificity. Specificity is defined as the ability to measure unequivocally the analyte of interest in the presence of other components that may be expected to be present (4,8). Both endogenous (bilirubin, glucose, ketones, proteins, immunoglobulin light chains) and exogenous (medications such as cephalosporins, dobutamine, and lidocaine) substances may interfere with Cr assays (4,8,9). The effect varies according to assay type, manufacturer, and Cr concentrations (4,8,9). At lower Cr concentrations the effect is generally significantly greater (4,9).
Most previous studies conducted in the post-IDMS era examining interlaboratory variability have utilized blood from a single source (i.e., blood donor) or pooled samples from multiple healthy individuals (5,10–12). These are not ideal to assess the effect of interfering factors that exist in real patients requiring clinical assessment. The effect of Cr variability on CKD diagnosis has never been examined. The aim of our study was to examine, in the post-IDMS era, the extent of interlaboratory variability of Cr measurement, its effect on eGFR and CKD diagnosis, and the differences between Jaffe and enzymatic assays in individual patient samples using a variety of methodology/manufacturer combinations.
Materials and Methods
Patients and Samples
Our study protocol was approved by the Queen’s University Health Science Research Ethics Board and adhered to the Declaration of Helsinki. In February of 2013, we collected residual human plasma from 53 inpatients admitted to critical care units. Critical care patients were selected as they have repeated phlebotomy in a short period of time which would allow for the high sample volumes required. In addition, they were likely to have diverse known (glucose, ketones, protein, bilirubin, medications) (8) and unknown interfering substances and therefore were more suitable for assessing the effect of assay nonspecificity on interlaboratory variability than standard external quality assurance (EQA) samples. The 53 patients were chosen to encompass the full spectrum of Cr concentrations, with some samples having elevated total bilirubin and/or glucose.
All available samples from each patient obtained over 2–3 consecutive days were pooled (three to five samples per patient), divided into aliquots (i.e., split samples), and frozen at −80°C. Samples were shipped on dry ice to participating laboratories in March of 2013. Samples were assayed between March and June of 2013.
Clinical laboratories were invited to participate through the Ontario Society of Clinical Chemists’ listserv and through the South Eastern Ontario community laboratory listserv. The laboratories were asked to measure the Cr in each patient on the same instrument on 2 consecutive days. Kingston General Hospital also measured the glucose (oxygen electrode rate method using glucose oxidase), total bilirubin (timed-endpoint Diazo “Jendrassik–Grof” method), and total protein (rate biuret method) once on each patient (Beckman UniCel DxC800 Synchron, Beckman Coulter Inc., CA).
Statistical Analyses
For each patient (n=53), we calculated the AMM (all methods mean), SD, minimum, maximum, and range for Cr using results from all 12 participating laboratories. In order to illustrate the effect of creatinine variability on eGFR variability, we also calculated the eGFR using the Chronic Kidney Disease Epidemiology Collaboration (CKD-EPI) equation (eGFR-EPI) assuming a 65-year-old nonblack woman (a typical patient in whom eGFR may be assessed). We determined its AMM, SD, minimum, maximum, and range across all 12 laboratories. These were then also calculated considering Jaffe and enzymatic laboratories separately. The AMM Cr and eGFR-EPI and mean ranges for Cr and eGFR-EPI values were then determined for the whole cohort and again after stratification by method (Jaffe versus enzymatic) and by Cr cut-off of 1.36 mg/dl (the median Cr across all samples).
Interlaboratory bias in Cr and eGFR-EPI was assessed by the mean difference and mean percentage differences from the AMM (% difference=[measured−AMM]/AMM×100) for each patient sample. The AMM was used as a surrogate for the reference method value which was not available. The AMM is routinely used by EQA programs instead of reference values where these are too costly or unavailable. For Cr, the AMM closely approximates the assigned reference method value in the Quality Management Program, Laboratory Services branch in Ontario (13).
Interlaboratory precision was determined as the range, the analytic coefficient of variation (CVa), and the SD for each patient, overall and by method (CVa = SD×100/mean). Intralaboratory between-day precision was determined as the CVa across each result (n=2) for each patient (n=53). We also looked specifically at patients with high concentrations of known interfering substances: total protein (>8 g/dl), bilirubin (>2.9 mg/dl), and/or glucose (>270 mg/dl).
In a subanalysis, we studied patients whose eGFR-EPI range included 60 ml/min per 1.73 m2, the cut-off for diagnosing CKD on the basis of eGFR alone (1). For each patient, the median eGFR-EPI, the eGFR-EPI range, and the percentage of laboratories that rendered an eGFR-EPI<60 ml/min per 1.73 m2 were determined. This was repeated considering assay method. In order to assess the potential effect of the Cr exponentials in the different GFR estimation equations on eGFR variability (14), we compared the eGFR ranges for this subgroup with the four variables using the Modification of Diet in Renal Disease (MDRD) equation and the CKD-EPI equation.
Significance of differences were assessed by t tests, assuming nonequal variance.
Results
Raw Data and Laboratories
Thirteen laboratories were recruited and each received one aliquot of the pooled plasma from each patient. All but one of the laboratories were in Ontario. One hospital measured Cr with both methods (Jaffe and enzymatic) and was counted as a separate laboratory for each method. The raw data were initially screened for outliers before proceeding with further data analysis. All data from one laboratory were excluded as 79% of their results were outside 3 SDs of the concentration means. This was felt to likely represent errors in transcription, sample handling, or labeling. For the remaining 12 laboratories, three (0.24%) of the 1272 results were >3 SDs of the mean, and 59 (4.6%) results were between 2 and 3 SDs. The final data analysis is on the basis of all 1272 results from the 12 laboratories, although the overall statistics (AMM, SD, CVa) were calculated from 1269 results with the three results >3 SD omitted.
There were four manufacturers (Ortho Clinical Diagnostics, Beckman Coulter, Roche Boehringer Mannheim Corporation (BMC), and Abbott Diagnostics) and nine different instruments represented in the final 12 laboratories, with seven laboratories using enzymatic assays (three from Ortho Clinical Diagnostics, two from Abbott, and two from Roche BMC) and five using kinetic Jaffe assays (two from Abbott, one from Roche BMC, and two from Beckman Coulter).
Cr and eGFR-EPI
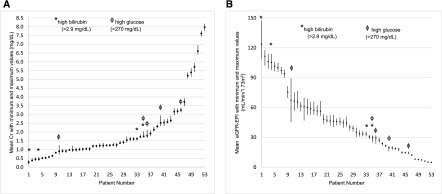
Individual patient AMM, minimum and maximum Cr, and eGFR-EPI values are shown in Figure 1 and in Supplemental Table 1. The range of Cr values varied among patients with smaller ranges at lower Cr values. The mean Cr range was 0.20±0.09 mg/dl for Cr<1.36 mg/dl and 0.33±0.12 mg/dl for Cr≥1.36 mg/dl (P<0.001). The range of eGFR-EPI also varied with, as expected, larger ranges at lower Cr values (14±9 ml/min per 1.73 m2 for Cr<1.36 mg/dl versus 4±3 ml/min per 1.73 m2 for Cr≥1.36 mg/dl; P<0.001).
Figure 1.
Individual patient creatinine and eGFR-EPI. (A) mean (box) and range (line) creatinine. (B) mean (box) and range (line) eGFR-EPI. Cr, creatinine; eGFR-EPI, Chronic Kidney Disease Epidemiology Collaboration eGFR.
On average, Jaffe Cr results were 0.07±0.10 mg/dl higher than enzymatic Cr results (P<0.001). The absolute differences between Jaffe and enzymatic results were even greater at higher Cr concentrations, with Jaffe values 0.10±0.09 mg/dl higher on average than enzymatic values for Cr≥1.36 mg/dl (P<0.001) and only 0.05±0.07 mg/dl higher when Cr<1.36 mg/dl (P<0.001).
On average, Jaffe eGFR-EPI values were 2.2±4.6 ml/min per 1.73 m2 lower than enzymatic ones (P<0.001). Patients with Cr concentrations <1.36 mg/dl had a Jaffe eGFR-EPI 3.4±6.1 ml/min per 1.73 m2 lower than enzymatic eGFR (P<0.001) on average, whereas the difference was only 1.0±1.1 ml/min per 1.73 m2 for samples with Cr≥1.36 mg/dl (P<0.001).
Interlaboratory Bias
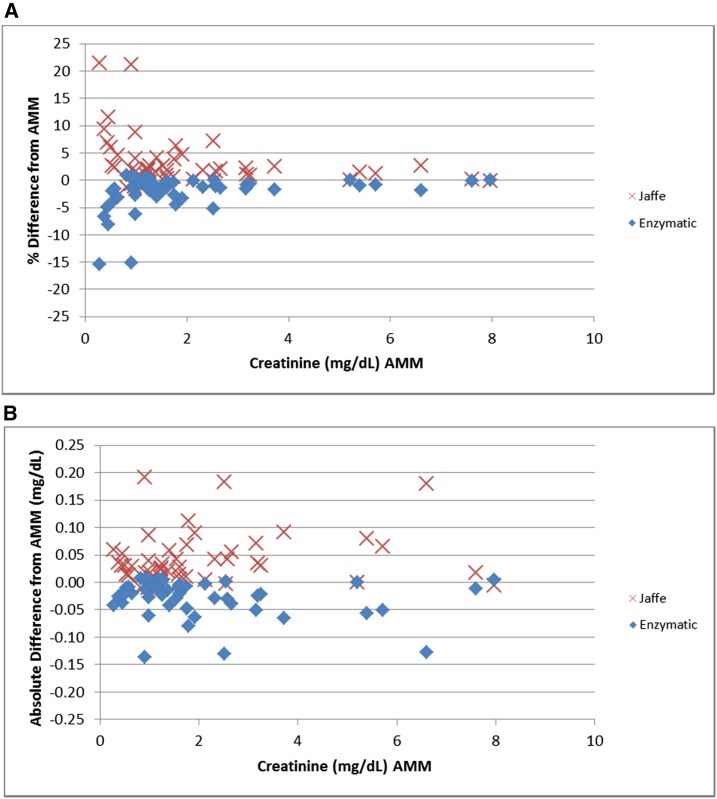
Figure 2 shows each patient’s mean Cr percentage difference and absolute difference from the AMM by method. As expected, enzymatic methods have a negative bias, whereas Jaffe methods have a positive bias compared with the AMM. The percentage biases are higher at lower Cr values whereas the absolute biases tended to be relatively constant (within ±0.11 mg/dl) across the entire range of Cr concentrations. There was, however, a large variation observed for different patients, ranging from −0.15 to 0.20 mg/dl.
Figure 2.
Bias: absolute and percentage differences in creatinine from all methods mean by method. (A) Percent bias. (B) Absolute bias. AMM, all methods mean.
Interlaboratory Precision
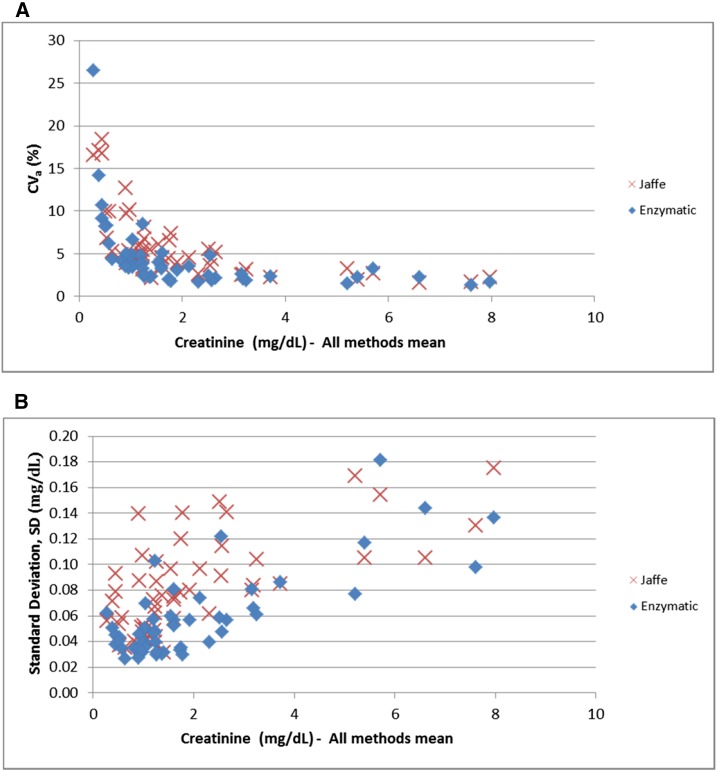
Results for the 53 patients varied significantly across laboratories. Creatinine CVas ranged from 1.3% to 26.5%, whereas SDs ranged from 0.02 to 0.18 mg/dl (Figure 3). Both were concentration- and method-dependent (Figure 3). Higher mean CVas were observed at lower Cr concentrations (8.2% for Cr<1.36 mg/dl versus 3.7% for Cr≥1.36 mg/dl; P<0.001) and with Jaffe methods compared with enzymatic methods (5.85% versus 4.4%; P=0.06). Only 57% of the 53 patients had a CVa<5% for the Jaffe methods compared with 79% of patients for enzymatic methods (P=0.02). As expected, the SDs were smaller at lower concentrations than at higher Cr concentrations (0.06 for Cr<1.36 mg/dl versus 0.10 for Cr≥1.36 mg/dl; P<0.001). Jaffe methods had higher SDs than enzymatic methods (0.08 versus 0.06 mg/dl, P<0.001). Only 30% of the 53 patients had an SD<0.06 mg/dl for the Jaffe methods compared with 60% of patients for enzymatic methods (P=0.003).
Figure 3.
Precision: coefficient of variation (%) and SD (mg/dl) of creatinine by method. (A) creatinine CVa. (B) Creatinine standard deviation. CVa, analytic coefficient of variation.
Effect on CKD Diagnosis
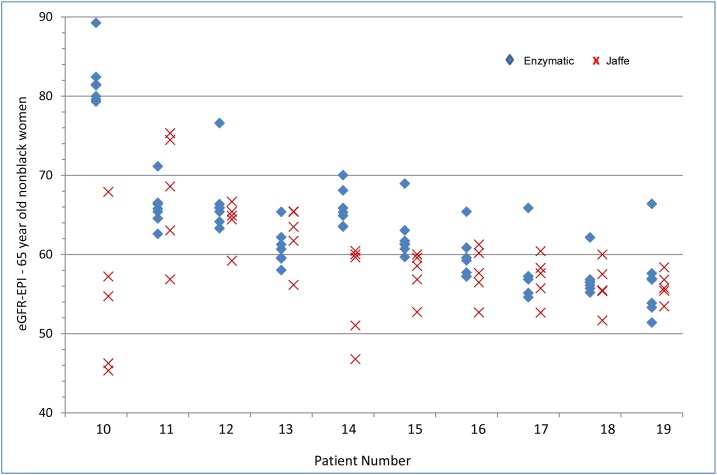
Ten patients had an eGFR-EPI range that included 60 ml/min per 1.73 m2 (Figure 4, Table 1). The median eGFR range for these ten patients was 15 ml/min per 1.73 m2, with maximum and minimum ranges of 49 and 9 ml/min per 1.73 m2. For 70% of the patients, three or more laboratories would disagree with the remaining laboratories with respect to the presence or absence of CKD. As Jaffe Cr results tended to be higher than enzymatic Cr results, the eGFR-EPI results calculated from Jaffe Cr results more frequently yielded a diagnosis of CKD. Sixty percent of Jaffe eGFRs were lower than 60 ml/min per 1.73 m2 as compared with 39% of enzymatic eGFRs. For four of the patients, no enzymatic laboratory yielded an eGFR-EPI<60 ml/min per 1.73 m2. There were no significant differences in the eGFR range by equation (MDRD versus CKD-EPI) used in these ten patients (Supplemental Table 2).
Figure 4.
Range of eGFR-EPI values around 60 ml/min per 1.73 m2. eGFR-EPI, Chronic Kidney Disease Epidemiology Collaboration eGFR.
Table 1.
Interlaboratory differences in CKD diagnosis (defined by eGFR-EPI<60 ml/min per 1.73 m2): percentage of laboratories with eGFR<60 ml/min per 1.73 m2
| Patient | Mean eGFR (SD) | Min–Max eGFR | Laboratories with eGFR≤60, % | Jaffe Mean eGFR (SD) | Jaffe Laboratories with eGFR≤60, % | Enzymatic Mean eGFR (SD) | Enzymatic Laboratories with eGFR≤60, % |
|---|---|---|---|---|---|---|---|
| 10 | 70 (15) | 45–89 | 33 | 53 (9) | 80 | 82 (3) | 0 |
| 11 | 67 (5) | 57–75 | 8 | 67 (8) | 20 | 66 (3) | 0 |
| 12 | 66 (4) | 59–77 | 8 | 64 (3) | 20 | 67 (5) | 0 |
| 13 | 62 (3) | 56–65 | 33 | 62 (4) | 20 | 61 (2) | 43 |
| 14 | 62 (7) | 47–70 | 17 | 55 (6) | 100 | 66 (2) | 0 |
| 15 | 60 (4) | 53–69 | 42 | 57 (3) | 100 | 62 (3) | 14 |
| 16 | 59 (3) | 53–65 | 58 | 58 (3) | 80 | 60 (3) | 71 |
| 17 | 57 (3) | 53–66 | 83 | 57 (3) | 100 | 58 (4) | 86 |
| 18 | 57 (3) | 52–62 | 83 | 56 (3) | 100 | 57 (2) | 86 |
| 19 | 56 (4) | 51–66 | 92 | 56 (2) | 100 | 56 (5) | 86 |
eGFR-EPI (ml/min per 1.73 m2) assuming 65-year-old nonblack woman. eGFR-EPI, Chronic Kidney Disease Epidemiology Collaboration eGFR; Min, minimum; Max, maximum.
Effect of Potential Interfering Substances
Eight patients had high concentrations of glucose or bilirubin. In several of these patients, the interlaboratory differences are marked (Figure 1, Table 2). Patient number 10 (glucose 441 mg/dl) had Cr ranging from 0.71 to 1.24 mg/dl (CVa 22%); patient number 4 (bilirubin 6.4 mg/dl) had Cr ranging between 0.36 and 0.57 mg/dl (CVa 18%); and patient number 1 (bilirubin 31.3 mg/dl) had Cr ranging between 0.16 and 0.41 mg/dl (CVa 30%).
Table 2.
Mean (SD), minimum and maximum, and CVa of creatinine of patients with known interfering substances
| Patient | Total Bilirubin, mg/dl | Glucose, mg/dl | Mean Cr (SD), mg/dl | Min–Max Cr, mg/dl | CVa, %a |
|---|---|---|---|---|---|
| 1 | 31.3 | 94 | 0.28 (0.08) | 0.16–0.41 | 30.2 |
| 4 | 6.4 | 196 | 0.45 (0.08) | 0.36–0.57 | 17.9 |
| 10 | 0.5 | 441 | 0.90 (0.19) | 0.71–1.24 | 21.6 |
| 33 | 5.8 | 65 | 1.61 (0.08) | 1.52–1.71 | 5.0 |
| 35 | 8.8 | 294 | 1.75 (0.10) | 1.67–2.04 | 5.6 |
| 36 | 0.6 | 270 | 1.78 (0.13) | 1.67–2.14 | 7.5 |
| 40 | 1.3 | 577 | 2.52 (0.19) | 2.33–2.94 | 7.5 |
| 46 | 0.2 | 315 | 3.25 (0.08) | 3.12–3.39 | 2.6 |
CVa, analytic coefficient of variation; Cr, creatinine; Min, minimum; Max, maximum.
CVa=SD of mean Cr×100/mean Cr.
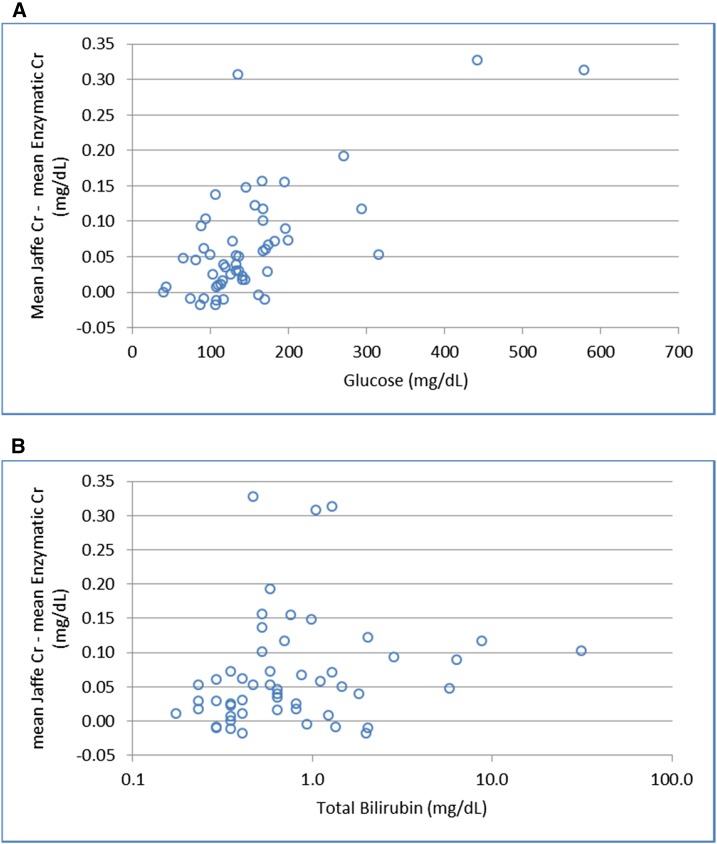
Figure 5 illustrates the differences in the mean Jaffe Cr compared with the mean enzymatic Cr for the 53 patients for the different glucose and total bilirubin concentrations. The differences between Jaffe and enzymatic results become more pronounced with increasing glucose once glucose concentrations are >90.1 mg/dl. Similarly, bilirubin>0.5 mg/dl is associated with greater differences between the two assay types.
Figure 5.
Differences between mean Jaffe and enzymatic creatinine (mg/dl) by glucose and bilirubin concentrations. (A) Difference by glucose concentration. (B) Difference by total bilirubin concentration. Cr, creatinine.
Intralaboratory Precision
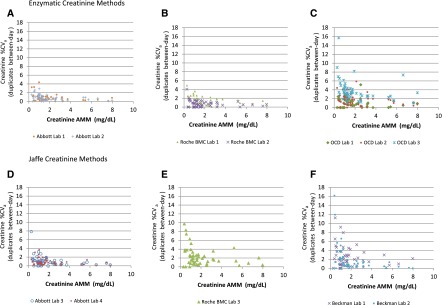
Between-day within-laboratory precision was dependent on the method and the manufacturer, as well as on the Cr concentration (Figure 6). Six laboratories (50%) using either Jaffe or enzymatic methods demonstrated CVas generally <2% above 1.13 mg/dl and generally <4%–5% below 1.13 mg/dl, thus meeting the “desirable” biologic variation precision goal of <2.2%, at least for the higher Cr concentrations (Abbott laboratories: numbers 1–4; Roche BMC laboratories: numbers 1, 2) (15). The remaining graphs highlight the variable performance across some assays/instruments/laboratories, as well as the much poorer performance at Cr concentrations <1.13 mg/dl.
Figure 6.
Intralaboratory precision by method and manufacturer. (A) Abbott. (B) Roche BMC. (C) OCD. (D) Abbott. (E) Roche BMC. (F) Beckman. AMM, all methods mean; %CVa, analytic coefficient of variation; OCD, Ortho Clinical Diagnostics; BMC, Boehringer Mannheim Corporation.
Discussion
This study, using individual patient samples and a range of assays and instruments, reveals that significant interlaboratory variability in Cr measurement continues to exist as evidenced by high CVas and SDs and wide ranges. In general, Jaffe assays yield higher Cr values than enzymatic assays, reflecting persistent bias despite IDMS standardization and leading to lower eGFRs and more CKD diagnoses. Jaffe assays also appear to be more susceptible to interfering substances, contributing to wider variability across laboratories.
Since the introduction of IDMS traceability, Cr measurement uncertainty and interassay variability have been examined in several jurisdictions (8,11,12). In France, Boutten et al. measured Cr in three different laboratories using enzymatic and compensated Jaffe assays produced by four different manufacturers in three serum pools derived from patients on no medications (11). For all but one manufacturer, Jaffe results were higher than the enzymatic results and precision was worse at the critical concentration of 0.84 mg/dl (11). In the United States, Greenberg et al. (8) analyzed individual patient samples including healthy controls (n=20, on no medications) and patients with a variety of clinical conditions (n=296 subjects, 365 samples) using four enzymatic methods and three Jaffe methods. For the healthy controls, bias ranged from –5.5%–5.8%. Coefficients of variation were not presented, but examination of bias graphs reveals less dispersion of the individual sample results and hence greater precision for the enzymatic procedures. For the clinical disease samples, “significant bias” (>10% or 0.10 mg/dl) was observed in 9%–12% of samples using enzymatic methods and in 16%–36% of samples using Jaffe methods. Similar to the healthy samples, coefficients of variation were not presented but very substantial dispersion of individual sample results for Jaffe methods as compared with enzymatic methods are evident, indicating increased interlaboratory variability. Another study compared eGFR between a single enzymatic assay and a single Jaffe assay (both Roche) and found the enzymatic assay yielded higher eGFR-EPIs in individual patients with type 2 diabetes (mean 85±23 ml/min per 1.73 m2 versus 81±19 ml/min per 1.73 m2; P=0.05) but not in healthy controls (16). Concurrent glucose values were not measured so it is unknown whether assay interference with glucose was occurring.
The effect of interfering substances, particularly at low serum Cr concentrations, is highlighted in our study. Most samples with elevated bilirubin or glucose levels displayed higher than average interlaboratory variability. Increasing glucose and bilirubin concentrations also yielded increasing differences between enzymatic and Jaffe results. Thus, interference by bilirubin further complicates kidney function assessment in those with advanced liver disease who have impaired Cr production due to impaired hepatic creatine synthesis, malnutrition, or muscle wasting (17). Likewise, in diabetes, a common clinical condition with a high risk of CKD and in which Cr measurement is recommended (1), hyperglycemia will contribute to variable and inaccurate Cr measurements.
The discordance between laboratories demonstrated in this study around the critical threshold of 60 ml/min per 1.73 m2 is clinically relevant. It will lead to confusion for clinicians and patients as to the presence or absence of CKD when serial results hail from different laboratories. A diagnosis of CKD has implications in terms of insurability, as has been revealed in kidney donor literature (18–20); medication dosing; disease labeling, with psychosocial implications; and increased resource utilization (referrals, testing), although these have not yet been specifically studied (21,22).
When following patients longitudinally, repeated measures should be performed in a single laboratory recognizing that inherent biologic variation, changing metabolic milieu (medications, glucose concentrations), and day-to-day intralaboratory analytic variability may contribute to observed variations in Cr concentration. In some instances, when results are substantially different than anticipated, Cr can be measured in another laboratory with a different assay. If still uncertain, then estimating or measuring GFR using alternate markers (e.g., cystatin C, iohexol, iothalamate) should be considered (1), while recognizing that these are also susceptible to analytic and biologic variation.
Strengths of our studies include the use of individual patient samples from an intensive care unit which are more suitable for the examination of the effect of interfering factors compared with the use of single samples or pooled samples from multiple healthy individuals, as commonly used in previous studies and in EQA programs. However, it should be acknowledged that these patients may have more potential interfering factors and therefore increased interlaboratory variability than the typical outpatient having Cr and eGFR assessed. In addition, our study includes a diversity of assays and manufacturers. Weaknesses include the absence of IDMS Cr measurements due to cost and we were therefore unable to determine true assay bias. Intralaboratory variability owing to multiple instruments within a single laboratory was not addressed as the protocol mandated repeat measures be performed on the same instrument. The real intralaboratory variability experienced clinically would be expected to be larger than the single intralaboratory variability reported in this study. Finally, the long-term intralaboratory analytic variability which is important when following a patient longitudinally over time was not examined.
In conclusion, it has long been recognized that a variety of patient-dependent factors (e.g., muscle mass, hepatic synthetic function, diet etc.) affect serum Cr concentration independently of GFR and that these contribute to the imprecision and inaccuracy of eGFR (23–25). The effect of measurement uncertainty in GFR estimation owing to persistent assay bias, imprecision, and nonspecificity is less well appreciated by clinicians and researchers who generally understand Cr measurement issues to have been “solved” by IDMS standardization.
IDMS standardization has been a very important achievement for Cr assay harmonization by addressing excessive bias that was due to nonstandardized calibration. However, significant interlaboratory variability in Cr measurement remains, due to residual bias and poor precision. The effect is greatest when Cr is not significantly elevated and when patients’ serum contains interfering substances. Enzymatic methods generate lower Cr and higher eGFR results and are more precise compared with Jaffe assays. At this time, interlaboratory Cr performance is not yet consistent enough to support serial monitoring of patient results across different laboratories. The variability around the fixed CKD eGFR cut-off of 60 ml/min per 1.73 m2 is problematic, particularly given enthusiasm for early CKD diagnosis, and needs to be recognized by clinicians interpreting results. Further improvements in Cr assay performance and monitoring are required by manufacturers and EQA providers to continue the necessary reductions in Cr bias and imprecision and interlaboratory variability.
Disclosures
None.
Supplementary Material
Acknowledgments
The authors would like to thank Y. Miu Lam (Department of Community Health and Epidemiology [Public Health Sciences], Queen’s University, Kingston, Ontario, Canada) for his help with the statistical analyses. This study was funded by Queen’s University Department of Medicine.
Footnotes
Published online ahead of print. Publication date available at www.cjasn.org.
This article contains supplemental material online at http://cjasn.asnjournals.org/lookup/suppl/doi:10.2215/CJN.05400516/-/DCSupplemental.
References
- 1.Kidney Disease: Improving Global Outcomes (KDIGO) Work Group : KDIGO 2012 clinical practice guideline for the evaluation and management of chronic kidney disease. Kidney Int 3: 1–150, 2012 [DOI] [PubMed] [Google Scholar]
- 2.Levey AS: Measurement of renal function in chronic renal disease. Kidney Int 38: 167–184, 1990 [DOI] [PubMed] [Google Scholar]
- 3.Komenda P, Beaulieu M, Seccombe D, Levin A: Regional implementation of creatinine measurement standardization. J Am Soc Nephrol 19: 164–169, 2008 [DOI] [PMC free article] [PubMed] [Google Scholar]
- 4.Myers GL, Miller WG, Coresh J, Fleming J, Greenberg N, Greene T, Hostetter T, Levey AS, Panteghini M, Welch M, Eckfeldt JH; National Kidney Disease Education Program Laboratory Working Group : Recommendations for improving serum creatinine measurement: a report from the Laboratory Working Group of the National Kidney Disease Education Program. Clin Chem 52: 5–18, 2006 [DOI] [PubMed] [Google Scholar]
- 5.Killeen AA, Ashwood ER, Ventura CB, Styer P: Recent trends in performance and current state of creatinine assays. Arch Pathol Lab Med 137: 496–502, 2013 [DOI] [PubMed] [Google Scholar]
- 6.Coresh J, Astor BC, McQuillan G, Kusek J, Greene T, Van Lente F, Levey AS: Calibration and random variation of the serum creatinine assay as critical elements of using equations to estimate glomerular filtration rate. Am J Kidney Dis 39: 920–929, 2002 [DOI] [PubMed] [Google Scholar]
- 7.Delanghe JR, Cobbaert C, Harmoinen A, Jansen R, Laitinen P, Panteghini M: Focusing on the clinical impact of standardization of creatinine measurements: a report by the EFCC Working Group on Creatinine Standardization. Clin Chem Lab Med 49: 977–982, 2011 [DOI] [PubMed] [Google Scholar]
- 8.Greenberg N, Roberts WL, Bachmann LM, Wright EC, Dalton RN, Zakowski JJ, Miller WG: Specificity characteristics of 7 commercial creatinine measurement procedures by enzymatic and Jaffe method principles. Clin Chem 58: 391–401, 2012 [DOI] [PubMed] [Google Scholar]
- 9.Cobbaert CM, Baadenhuijsen H, Weykamp CW: Prime time for enzymatic creatinine methods in pediatrics. Clin Chem 55: 549–558, 2009 [DOI] [PubMed] [Google Scholar]
- 10.Pieroni L, Delanaye P, Boutten A, Bargnoux AS, Rozet E, Delatour V, Carlier MC, Hanser AM, Cavalier E, Frosissart M, Cristol JP: A multicentric evaluation of IDMS-traceable creatinine enzymatic assays. Clin Chem Acta 412: 2070–2075, 2011 [DOI] [PubMed] [Google Scholar]
- 11.Boutten A, Bargnoux AS, Carlier MC, Delanaye P, Rozet E, Delatour V, Cavalier E, Hanser AM, Froissart M, Cristol JP, Piéroni L; Société Française de Biologie Clinique : Enzymatic but not compensated Jaffe methods reach the desirable specifications of NKDEP at normal levels of creatinine. Results of the French multicentric evaluation. Clin Chim Acta 419: 132–135, 2013 [DOI] [PubMed] [Google Scholar]
- 12.Carobene A, Ceriotti F, Infusino I, Frusciante E, Panteghini M: Evaluation of the impact of standardization process on the quality of serum creatinine determination in Italian laboratories. Clin Chim Acta 427: 100–106, 2014 [DOI] [PubMed] [Google Scholar]
- 13.Institute for Quality Health Care Institute for Quality Management in Healthcare. Available at http://iqmh.org. Accessed May 30, 2016
- 14.Delanaye P, Cavalier E, Cristol JP, Delanghe JR: Calibration and precision of serum creatinine and plasma cystatin C measurement: impact on the estimation of glomerular filtration rate. J Nephrol 27: 467–475, 2014 [DOI] [PubMed] [Google Scholar]
- 15.Westgard J: Tools, Technologies and Training for Healthcare Laboratories, 2015. Available at https://www.westgard.com/. Accessed May 30, 2016
- 16.Cheuiche AV, Soares AA, Camargo EG, Weinert LS, Camargo JL, Silveiro SP: Comparison between IDMS-traceable Jaffe and enzymatic creatinine assays for estimation of glomerular filtration rate by the CKD-EPI equation in healthy and diabetic subjects. Clin Biochem 46: 1423–1429, 2013 [DOI] [PubMed] [Google Scholar]
- 17.Caregaro L, Menon F, Angeli P, Amodio P, Merkel C, Bortoluzzi A, Alberino F, Gatta A: Limitations of serum creatinine level and creatinine clearance as filtration markers in cirrhosis. Arch Intern Med 154: 201–205, 1994 [PubMed] [Google Scholar]
- 18.Matas AJ, Ibrahim HN: The unjustified classification of kidney donors as patients with CKD: critique and recommendations. Clin J Am Soc Nephrol 8: 1406–1413, 2013 [DOI] [PMC free article] [PubMed] [Google Scholar]
- 19.Lenihan CR, Tan JC: The consequences of chronic kidney disease mislabeling in living kidney donors. Mayo Clin Proc 89: 1126–1129, 2014 [DOI] [PMC free article] [PubMed] [Google Scholar]
- 20.Yang RC, Thiessen-Philbrook H, Klarenbach S, Vlaicu S, Garg AX; Donor Nephrectomy Outcomes Research (DONOR) Network : Insurability of living organ donors: a systematic review. Am J Transplant 7: 1542–1551, 2007 [DOI] [PubMed] [Google Scholar]
- 21.Fink HA, Ishani A, Taylor BC, Greer NL, MacDonald R, Rossini D, Sadiq S, Lankireddy S, Kane RL, Wilt TJ: Screening for, monitoring, and treatment of chronic kidney disease stages 1 to 3: a systematic review for the U.S. Preventive Services Task Force and for an American College of Physicians Clinical Practice Guideline. Ann Intern Med 156: 570–581, 2012 [DOI] [PubMed] [Google Scholar]
- 22.Akbari A, Clase CM, Acott P, Battistella M, Bello A, Feltmate P, Grill A, Karsanji M, Komenda P, Madore F, Manns BJ, Mahdavi S, Mustafa RA, Smyth A, Welcher ES: Canadian Society of Nephrology commentary on the KDIGO clinical practice guideline for CKD evaluation and management. Am J Kidney Dis 65: 177–205, 2015 [DOI] [PubMed] [Google Scholar]
- 23.White CA, Huang D, Akbari A, Garland J, Knoll GA: Performance of creatinine-based estimates of GFR in kidney transplant recipients: a systematic review. Am J Kidney Dis 51: 1005–1015, 2008 [DOI] [PubMed] [Google Scholar]
- 24.Stevens LA, Levey AS: Measured GFR as a confirmatory test for estimated GFR. J Am Soc Nephrol 20: 2305–2313, 2009 [DOI] [PubMed] [Google Scholar]
- 25.Rule AD, Glassock RJ: GFR estimating equations: getting closer to the truth? Clin J Am Soc Nephrol 8: 1414–1420, 2013 [DOI] [PMC free article] [PubMed] [Google Scholar]
Associated Data
This section collects any data citations, data availability statements, or supplementary materials included in this article.


