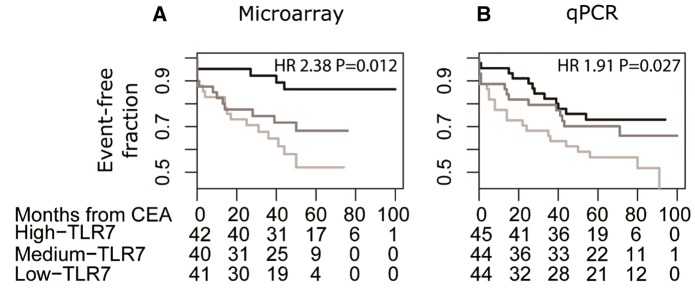
Figure 1.
Worse outcome were found for patients with lower levels of TLR 7 transcript in their plaques. Kaplan–Meier curve illustrating MACCE-free survival of patients with TLR7 expression of highest tertile (black), the middle tertile (dark grey) and the lowest tertile (light grey). (A) Microarray cohort with 34 MACCE and 24 ischaemic event. (B) qPCR cohort with 47 MACCE and 33 ischaemic events. Below each plot, the count of event-free patients is indicated. The x-axis scale of the study was time since CEA in months. Hazard ratio (HR) for the lowest tertile of TLR7 expression vs. the middle and highest tertiles combined from a Cox regression is reported in the upper-right corner.

