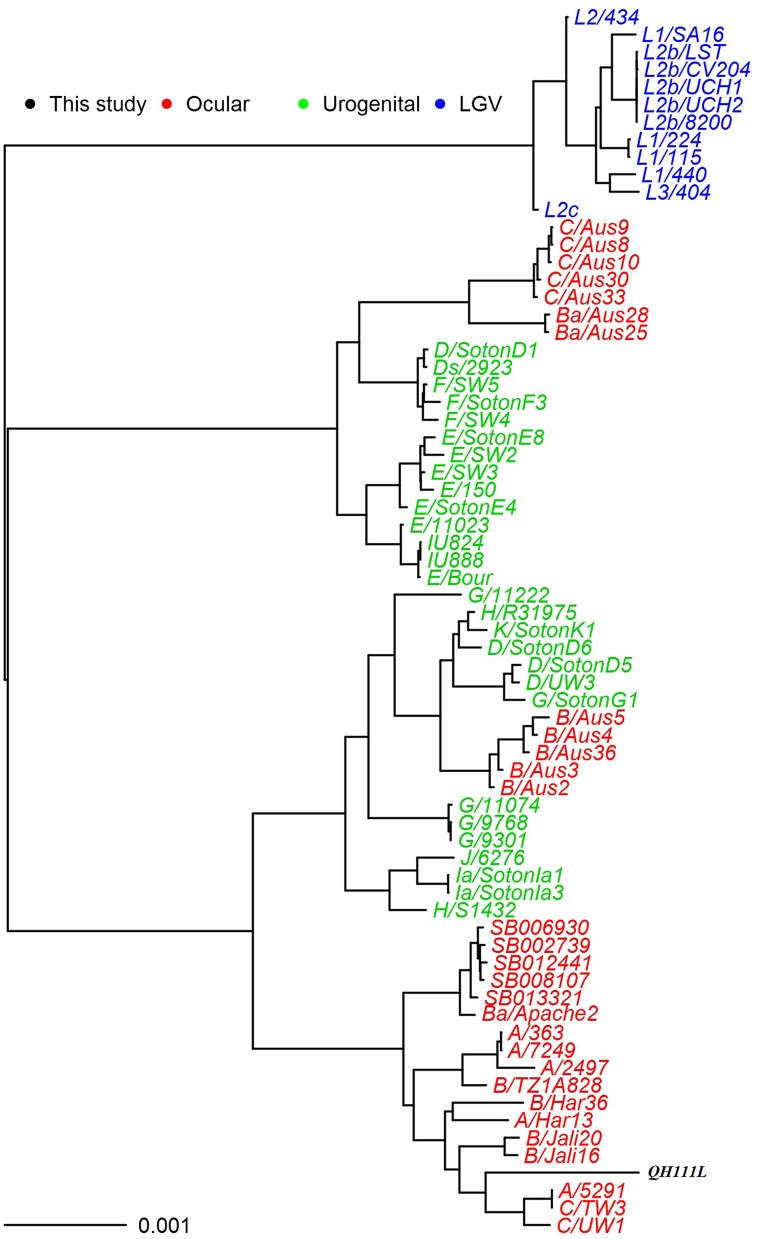
Figure 3.
Maximum likelihood reconstruction of the whole-chromosome phylogeny of the QH111L and reference isolates. Sequences were mapped to C. trachomatis A/Har13 using SAMtools (Li et al., 2009). SNPs were called as described (Harris et al., 2012). Phylogenies were computed with RAxML (Stamatakis et al., 2008) from a variable sites alignment using a GTR+gamma model and are midpoint rooted. The scale bar indicates evolutionary distance. The sequences collected in this study are colored black, reference isolates are colored by tissue tropism (red, ocular reference sequences; green, urogenital reference sequences; blue, LGV reference sequences).

