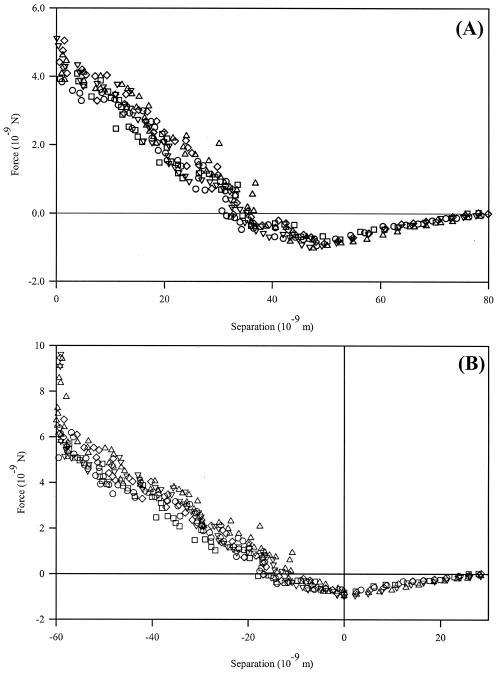
FIG. 2.
C. parapsilosis approach curves with unmodified silicon nitride probe. Data shown represent three measurements on a single cell. Based on the method of Ducker and Senden (16), the curves appear as in panel A, with the constant compliance region aligned with the vertical axis. However, according to contact mechanics (9), we may also define the minimum of the attractive force, viz., where all force gradients acting on the cantilever sum to zero, as the cell surface (B). Whether either method accurately describes the polymer layer on the surface has yet to be determined.

