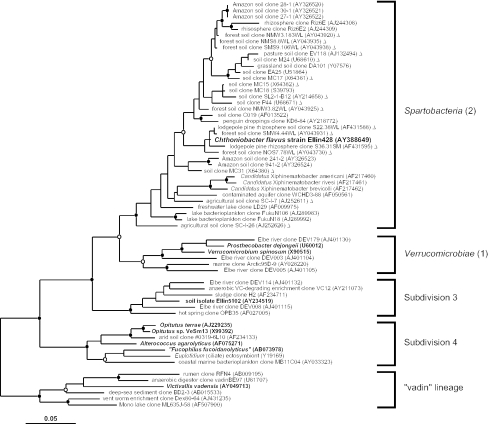
FIG. 2.
Maximum-likelihood dendrogram of the phylum Verrucomicrobia based on comparative analysis of 16S rRNA gene data. Subdivision numbering according to the method of Hugenholtz et al. (23) and associated class names are shown to the right of the figure. Only subdivisions with at least one cultivated representative (shown in boldface) are included in the dendrogram. Chthoniobacter flavus strain Ellin428 is shown in boldface and a larger typeface. Partial length sequences (<1,250 nucleotides), included in the maximum-likelihood inference but not in the statistical resampling, are indicated by triangles, and their positions in the Spartobacteria should be regarded as approximate. Each 16S rRNA (gene) sequence is identified by its origin, name, and GenBank accession number. Branch points supported by bootstrap resampling and posterior probabilities are indicated by solid circles (values > 90%) and open circles (values > 75%). Six representatives of the closely related “vadin” lineage (57) were used as the outgroup for the analysis. The scale bar indicates 0.05 changes per nucleotide.

