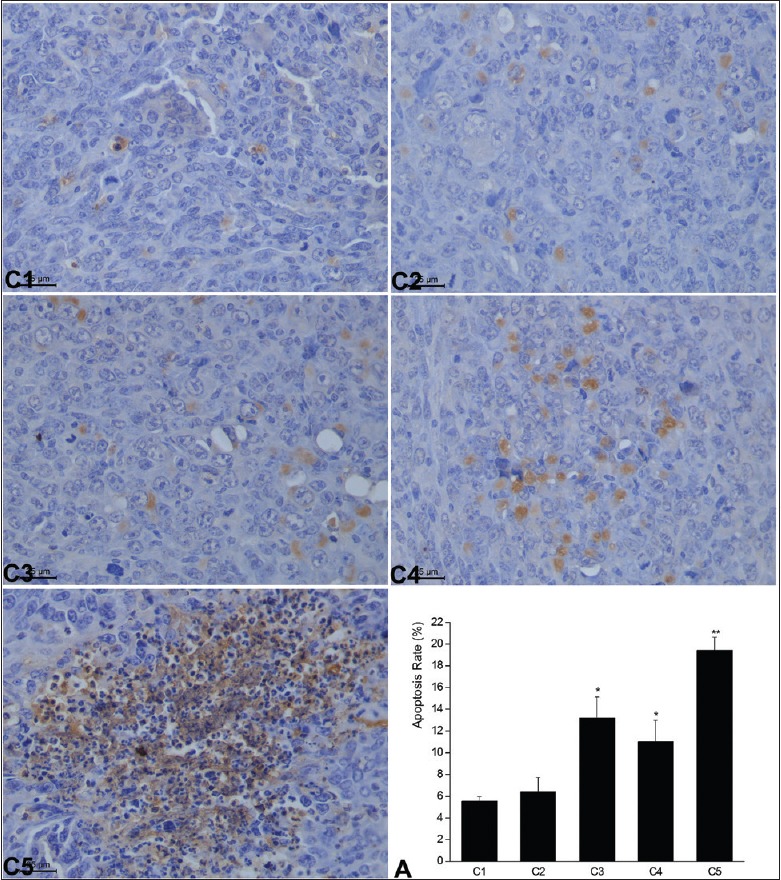
Figure 4.

Multiple pulses of microwave radiation-induced cell apoptosis of Lewis lung carcinoma tumors assessed by transferase dUTP nick-end labeling staining. The percentage of apoptotic cells in each group on day 7 (mean ± standard deviation). *P < 0.05, **P < 0.01 versus the untreated control group (C1). C2: 10 mW/cm2 × 5 min each day, C3: 10 mW/cm2 × 15 min each day, C4: 30 mW/cm2 × 5 min each day, C5: 30 mW/cm2 × 15 min each day. All the groups were treated for 7 continuous days; A: The bar graph showed the cell apoptosis rate in the lung of each group. Data were presented as mean±SD of the apoptosis rate from all the mice in each group as indicated.
